Andor Technology

7 Millennium Way Springvale Business Pk
Belfast, Northern Ireland BT12 7AL
United Kingdom
44-28-9023-7126
44-28-9031-0792
400

More Info on Andor Technology

Designs and manufactures imaging and spectroscopy cameras and microscopy solutions for leading academic and research establishments across scientific disciplines, including physics, chemistry, biology, and astronomy.

Articles

(Image credit: Oxford Instruments Andor)
oxford_instruments_andor
The Marana 4.2B-6 back-illuminated 4.2-Mpixel scientific CMOS (sCMOS) model now offers a low noise mode with read noise of 1.0 e-.
Andor Technology
The ZL41 sCMOS camera can transform a regular fluorescence microscope into a super-resolution microscope.
Andor Technology
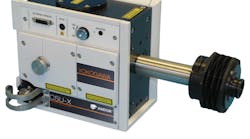
The Marana-X direct x-ray detection back-illuminated sCMOS camera is designed for ultrafast soft x-ray/EUV tomography applications.
Andor Technology
The Marana 4.2B-6 back-illuminated scientific camera offers 95% quantum efficiency and vacuum cooling down to -45°C.
Andor
The Sona 4.2B-6 back-illuminated microscopy camera has a 4.2 Mpixel sensor format with a 6.5 µm pixel size for obtaining maximum resolution from 60x and 40x objective lens magnification...
Andor
I Xon
In an MIT Lincoln Labs project, potentially blinding laser beams are triangulated by their scattered light and pinpointed using Google Earth.
1809 Lfw Pro 1
The back-illuminated Sona 4.2B-11 and Sona 2.0B-11 sCMOS microscopy camera features a 4.2 or 2.0 Mpixel on-sample field of view.
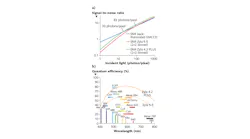
FIGURE 1. A comparison (a) of the signal-to-noise ratio vs. photon intensity for two types of Zyla cameras made by Andor Technology to that of the company’s iXon back-illuminated electron-multiplying CCD (EMCCD) shows that the EMCCD is best for the lowest photon rates, including single photon counting, while sCMOS takes over for higher (but still very low) photon rates). The quantum efficiency (QE) of Andor’s Zyla cameras is optimized for use with a range of fluorophores (b).
sCMOS cameras are now widely used in a variety of leading-edge microscopy techniques, as well as in astronomy and elsewhere.
(Image: NASA)
Depiction of two neutron stars about to collide.
Gravitational-wave detection combined with observation of photon emission from the collision provide insights.
(Image credit: Andor)
IMAGE: A custom-designed Andor iKon-XL Astronomy CCD was successfully deployed on the new Antarctica Bright Star Survey Telescope (BSST); its spatial resolution, extended dynamic range, and low-noise performance increase the possibility of finding more stars and planetary systems in the hunt for Super-Earths.
A custom-designed Andor iKon-XL Astronomy CCD was successfully deployed on the new Antarctica BSST.

Buyer’s Guide Listing Information

Click here for listing information and directions on how to add or update your company.

Request More Information From Andor Technology

By clicking above, I agree to Endeavor Business Media's Terms of Service and consent to receive promotional communications from Endeavor, its affiliates, and partners per its Privacy Notice. I also understand my personal information will be shared with the sponsor of this content, who may contact me about their offerings per their privacy policy. I can unsubscribe anytime.

Additional content from Andor Technology

(Image credit: Andor)
A high-speed scientific CMOS (sCMOS) camera offers very high frame rates of 4000 frames per second (fps) with all the standard advantages of sCMOS technology. Most sCMOS cameras have imaging speeds in the 100 fps realm.
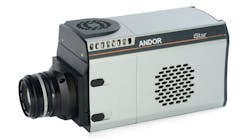
Andor Technology launched its new iStar platform featuring the latest in high-speed, low-noise sCMOS technology.
(Figure: University of Twente)
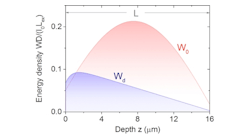
The blue curve shows the expected fall-off of energy density with increasing penetration depth of light in a scattering medium (the small dip at the entering surface is a function of the scatterer's mean free path). The red enhanced diffusion curve shows a very different result: a sharp rise, resulting in much more energy stored inside the scattering layer.
An SLM shapes the incoming wavefront, boosting stored light power within the medium by 4.6 times.
(Figure courtesy of Andor)
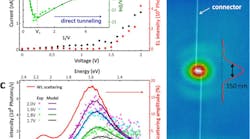
Current versus voltage (I‐V) plot of a connected antenna with tunnel gap (a). For applied voltages above 1.5 V, light is detected whose intensity grows linearly with the current. Inset: Fowler‐Nordheim representation of the same I‐V data and fit (solid line) using the Simmons model (with image charges, s=1.27 nm, φeff=2.56 eV, w=2.14 nm, εCTAB=1.435, Ioffset=50 pA, Ileakage=0). Electron micrograph of a structure superimposed with the subwavelength emission spot shows an Airy pattern with a FWHM of 350 nm (b). Weak background illumination was used to visualize the outline of the structure. Electroluminescence spectra for various applied voltage (c; open symbols). Solid red line: scattering spectrum of an unbiased antenna. Solid colored lines represent calculated electroluminescence spectra obtained according to the model described in the text. A global scaling factor was used to match the experimental data.
Researchers used Andor's Shamrock spectrometer and iXon EMCCD camera in their experiments.
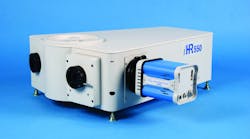
FIGURE 1. The shape of Horiba's iHR550 imaging spectrometer is dictated by its requirements.
Spectral imaging is finding more and more applications in life sciences, from noninvasive disease diagnosis to food processing. Various imaging spectrometers make those applications...
Abingdon, England--Andor will continue to focus on growing their existing core markets and will spearhead Oxford Instruments' strategic expansion into the nano-bio arena.
1401prod Andor
Borealis improves uniformity ~10 fold, increases throughput by a factor of two, and extends the excitation wavelength range to 400-750 nm.
(Courtesy of Headwall Photonics)
FIGURE 1. A hyperspectral image from Headwall Photonics' Micro-Hyperspec sensor was taken from a fixed-wing aircraft.
Imaging spectrometers capture enormous quantities of data in a 2D form that is relevant to areas from science and security to industry and art.
(Image credit: Andor)
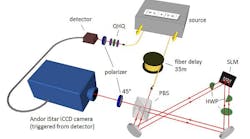
Einstein called quantum entanglement 'spooky action at a distance'. Now, a team from the Vienna Center for Quantum Science and Technology has reported imaging of entanglement events where the influence of the measurement of one particle on its distant partner particle is directly visible using the Andor iStar ICCD camera.
Belfast, Ireland--The Vienna Center for Quantum Science and Technology has used an Andor ICCD camera to image quantum entanglement events Einstein called "spooky action at a distance...
Andor
An Optically Centred Crop Mode is now available on the iXon Ultra 897 EMCCD camera from Andor Technology, which offers fast frame-rate performance from a region of interest (ROI...
Courtesy of Andor
A new technique is shedding light on global warming gases:3D time-sliced coincidence images of nitrous oxide and total kinetic energy released distributions at different vibronic levels are shown. The electric vector E of synchrotron radiation is noted as the vertical direction of the image plane, where (a)–(c) are recorded at 20.100, 20.260, and 20.390 eV, respectively, and corresponding to the C(0,0,0), C(1,0,0), and C(0,0,1) vibronic levels. Least-squares fitting of the total KERD curves with two gaussian profiles are plotted with the solid line. This data, which is acquired with the help of an Andor iKon-M camera, is used to gain a better understanding of the characteristics, origins, and concentrations of global-warming gases like nitrous oxide.
Belfast, Ireland--Andor iKon-M cameras are at the heart of a new TPEPICO imaging technique that can determine the formation pathways of global-warming nitric oxide gases.
(Image courtesy of Andor Technology)
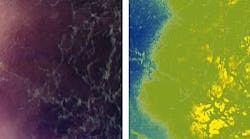
Comparative RGB (left) and hyperspectral (right) images of a melanoma.
Researchers from the Shizuoka Cancer Center Research Institute in Japan have developed an automated, noninvasive melanoma screening system that may eliminate the need for a morphologica...
(Image and caption courtesy of Harvard Medical School)
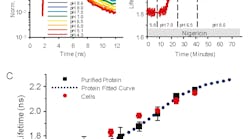
pH response of pHRed fluorescence lifetime (630 nm emission) with 860 nm two-photon excitation, where a) represents pH response of peak normalized fluorescence lifetime decays of purified pHRed in solution and b) shows intracellular pH in live Neuro2A cells imaged with FLIM. The nigericin method was used to manipulate pH. c) pH response of pHRed fluorescence lifetime in cells (n = 6) and protein in solution (n = 3) in solution agreed well with an apparent pKa of 6.9 (0.2, similar to the F575/F440 intensity ratio response.
Researchers from Harvard Medical School have engineered the first ratiometric, single-protein red fluorescent pH sensor.