Spectroscopy: Back-illuminated CCDs enable advanced spectroscopy instrumentation
Spectroscopy is a powerful tool used to study light-matter interactions. When light interacts with matter, it is usually reflected, transmitted, absorbed, or scattered, and researchers use this spectral data to help characterize and quantify a sample.
Key spectroscopic techniques include Raman spectroscopy, photoluminescence (PL), fluorescence, emission, absorption, microspectroscopy (micro-Raman, micro-PL, etc.), and hyperspectral imaging. Applications can involve nanoparticles, nanowires, carbon nanotubes, medical and biomedical samples, semiconductors, pharmaceuticals, and a variety of other materials. Taking full advantage of these spectroscopic techniques requires state-of-the-art light research equipment.
Back-illuminated CCD technology
Detection systems for spectroscopy are typically 2D silicon charge-coupled device (CCD) arrays, capable of operation from <200 to 1100 nm. CCDs are available with front- and back-illuminated sensors of various designs. Back-illuminated CCDs include a depletion region of epitaxial silicon varying in thickness from ~13 to 40 μm, with the latter designed for improved red quantum efficiency (QE). These are mainstream detectors for spectroscopy because they offer excellent sensitivity, low noise performance, and a variety of configurations to meet the needs of researchers.There are other detector options for spectroscopy, including CMOS, PMTs, and solid-state single point detectors—however, CCDs are still dominant in spectroscopic applications. Back-illuminated CCDs are the preferred detection systems for spectroscopy because they offer the highest QE.
Back-illuminated, or back-thinned, CCDs are manufactured by chemically etching and polishing a silicon wafer to a thickness between 13 and 40 μm. The sensor operates so that light impinges on the epitaxial silicon layer without passing through the polysilicon gates, hence the term back-illuminated. Back-thinned CCDs offer up to 95% QE and are useful in a variety of ultraviolet/visible/near-infrared (UV-VIS-NIR) applications. However, some NIR light transmits through the thinned silicon above ~850 nm, resulting in a decrease in NIR QE. Since QE at NIR wavelengths is proportional to the thickness of the silicon depletion region, a 40-μm-thick deep-depletion sensor will have higher QE than a 13-μm-thick sensor.
It is also important to note that silicon-based CCDs will not operate above ~1100 nm, so indium gallium arsenide (InGaAs) detectors are the best choice. InGaAs detectors are available as linear or 2D arrays and will operate from ~850 to 1700 nm (extended range to 2200 nm). InGaAs has inherently higher higher dark current than silicon and typically incorporates liquid nitrogen (LN) cooling for best performance.
A new generation of spectroscopic CCDs
With the goal of significant improvements in spectroscopic detection, two new silicon-based CCD sensors have been developed. The first, HR-sensors, are designed for the highest NIR-QE available from any spectroscopic CCD. The second, LD-sensors, are designed for extremely low dark current, ideal for demanding low-light applications.
Both sensors were designed around 1340 × 100 and 1340 × 400-pixel spectroscopy formats with 20 μm pixels, and can be cooled to -95°C in air using thermoelectric cooling (TEC). For applications requiring fast spectral rates, the sensors can operate with ADC speeds up to 16 MHz dual port, allowing thousands of spectra per second.
The deep-depletion HR-sensors were developed using high-resistivity silicon, resulting in the highest NIR-QE available from any spectroscopic CCD. At 1000 nm, QE can be 2–4X greater than the best deep-depletion sensors. This is accomplished by creating a silicon depletion region nearly 4X thicker than current deep-depletion sensors. To maintain high spatial resolution, HR-sensors are operated fully depleted by applying a bias voltage, which constrains electrons to their intended gates.
Deep depletion LD-sensors operate in inverted mode for extremely low dark current performance, making them ideal for low-light applications. Inverted-mode operation applies negative voltages to the imaging phases, driving each phase into inversion. This negative charge attracts holes, which fill the surface states resulting in suppression of dark current generation in the surface states. Inverted mode operation with TE-cooling results in a reduction of dark current to 0.0005 e-/pix/sec (typical), making LD-sensors ideal for experiments with long integration times.
To meet the needs of applications involving fast spectral rates such as pump-probe experiments, we incorporate dual-channel readout ports with the fastest ADC speeds available in CCD cameras. HR-sensor cameras can operate up to 16 MHz with dual ports, while LD-sensors operate with dual 10 MHz readout ports. Depending on the sensor size, this enables spectra rates up to thousands of spectra per second (full vertical binning) and up to 215 kHz spectral rate in kinetics mode.
For demanding low-light spectroscopic applications, we designed in our high efficiency ArcTec TE-cooling, allowing operation of the cameras with sensors cooled to -95 C in air. Operation at -100°C is also possible using 20°C liquid, allowing long integration times without risking damaging condensation inside the camera. Sensors are mounted inside a high vacuum metal-sealed chamber to ensure long-term performance. Since dark-current generation is a thermal process, deep cooling is essential for low-noise performance.
Testing the sensors
The HR-sensor has been tested in three experiments. The first involved acquisition of atomic lamp emission from 880 to 1000 nm, comparing the sensitivity of the HR-sensor to an LN-cooled InGaAs array. The second experiment compared indocyanine green (ICG) photoluminescence (PL) acquired with the HR-sensor and LN-cooled InGaAs linear array from ~880 to 1000 nm. Ant the third used of the HR-sensor to acquire Raman spectrum of cyclohexane from 150 to 3300 cm-1.
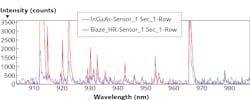
Figure 1 shows two advantages offered by the HR-sensors in the acquisition of atomic spectra. In this experiment, we acquired the spectra using a camera with the HR-sensor and an InGaAs camera, operated under identical conditions with the same spectrograph, grating, and light source.
Under identical experimental conditions, the intensity of spectral lines acquired using the HR-sensor (green) was significantly higher than the InGaAs spectra (orange). Weak spectral lines not detected by the InGaAs camera are clearly visible using the HR-sensor. In addition, and not surprisingly, background noise is significantly lower for the HR-sensor.
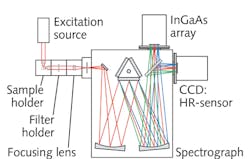
As shown in Figure 2, the output of an excitation light source is focused onto a cuvette containing the ICG sample using a lens. PL-emission is collected and collimated using another lens 90° from the excitation beam. The collimated beam passes through a filter where it is focused onto the entrance slit of the spectrograph equipped with two detectors: a CCD with HR-sensor and an LN-cooled InGaAs array.
A moveable beam-diverter mirror allows dispersed PL-emission to be directed to either array detector for analysis. System operation and data acquisition were controlled using our LightField software.
PL spectra were acquired using both cameras, allowing the integration time to be adjusted to yield the same relative intensity. Integration time was 15 seconds for the HR-sensor and 100 seconds for the InGaAs array. Intensity calibration was performed using the IntelliCal calibration system and a NIST-traceable quartz tungsten halogen (QTH) lamp to eliminate unwanted instrumental influences on the spectral data.
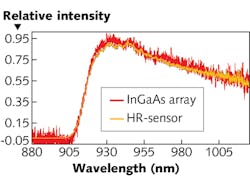
Figure 3 shows good correlation between spectra produced by each camera. The major differences are twofold: firstly, the HR-sensor provided ~6.6 greater sensitivity and, secondly, the HR-sensor produced spectra with significantly lower background noise.
Figure 4 shows the Raman spectrum of cyclohexane from ~150 to 3000 cm-1. In this experiment, a 500 mW, 785 nm laser generated Raman scatter within the cyclohexane sample. A lens collected and collimated the Raman scatter, which then passed through a Rayleigh filter to suppress the 785 nm laser radiation. A 300 mm spectrograph dispersed the Raman scatter onto the HR-sensor for detection and analysis. In this experiment, the HR-sensor’s improved QE allowed fast detection of the Raman signal out to 3000 cm-1 (1026 nm).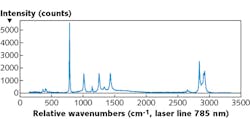
Researchers involved in low-light spectroscopy applications such as Raman spectroscopy and photoluminescence require high QE detection systems and imaging spectrographs to take full advantage of these analysis methods. New HR and LD-Sensor based Blaze cameras, combined with advanced IsoPlane and HRS imaging spectrographs, can create spectroscopic research systems capable of high spectral resolution, fast spectral rates, and exceptional detection capabilities.
About the Author
Michael Case
Director of Spectroscopy and Thin Film Engineering, Teledyne Princeton Instruments
Michael Case is Director of Spectroscopy and Thin Film Engineering at Teledyne Princeton Instruments (Acton, MA).