Quantitative Spectroscopy/Bioanalytics: Getting valid results with spectrometry
ALEXANDER SCHEELINE
Spectroscopic analysis is valued for biological applications for many reasons, including some cases where it is nondestructive or requires no molecular labeling. Spectrometry—that is, the application of spectroscopy for quantitative measurement—is being increasingly applied in environmental monitoring, point-of-care medicine, home medical diagnostics, and agriculture, in addition to non-bio applications in homeland security, defense, and education.
Unfortunately, though, wanting to make a measurement is not necessarily correlated with getting valid, usable results. So, how do you know that your spectroscopic analysis will produce accurate results?
Measure what you want
One of the great illusions of analytical chemistry is that what works for pure samples in distilled water in a well-maintained laboratory will work well with any real-world sample.1 The first step in ensuring valid outcomes is using a sufficiently characterized representative sample—one in which the concomitants of the unknown are understood, interferences characterized, and thermal and chemical history adequately documented.
Next is to choose a measurement strategy-there are usually dozens of approaches to any measurement problem. Assuming you've determined that spectroscopy will help you achieve your goal, let's say you wish to measure equilibrium absorbance in the ultraviolet (UV; 193–400 nm), visible (400–750 nm), or near-infrared (near-IR; 750–2500 nm) spectral regions. Even within the class of absorption measurements, it is necessary to choose either a single (or narrow) range of wavelengths that is selective for the species of interest, or else a wide range of wavelengths from which you can chemometrically extract patterns that correlate with the sought-for quantity.
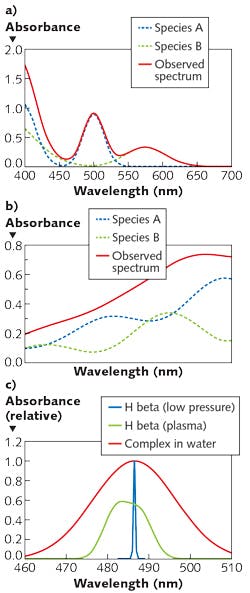
While it is typical to make selective absorption measurements in the UV or visible range, and pattern measurements in the near-IR, it is certainly possible to make pattern measurements in the UV or visible. Of note for biomedical applications (for which the near-IR range is particularly relevant, given its ability to penetrate tissue) is that narrow-range measurements in the near-IR are uncommon because distinct, selective features are rare. Figure 1 shows examples of visible and near-IR spectra, and optical transitions of various widths.
Considering a couple of questions can help:
1. What spectral features selectively characterize the analyte? Do the interferences produce phenomena at or near the same wavelength? How wide is the atomic or molecular transition? Atomic absorption lines have widths typically below 0.05 nm. Molecular absorption transitions in the visible and UV span ~10-50 nm with few exceptions (chromophores in the hydrophobic cores of proteins may be <1 nm in width). Features in the near-IR have widths from ~1 nm to hundreds of nanometers, and are highly overlapped with absorbances from matrix materials and solvents.
2. What is the molar absorptivity of the analyte at its optimal wavelength? What concentration is expected? The Beer-Lambert Law, which says absorbance is proportional to concentration, applies for samples at low concentration where analyte molecules are individually solvated and do not noticeably perturb the solvent. The Law, Absorbance = pathlength times concentration times a scale factor (A=bCε), is deceptively simple. It assumes you are looking at a single wavelength or a range of wavelengths over which the scale factor, the molar absorptivity, is constant. If ε = 50000 L mol-1 cm-1, in a 1 cm cuvette one can measure A ~0.01 for quantitation of 0.2 μM analyte. What happens if the concentration is 1 mM? That is a factor of 5000 higher, leading to an extrapolation that A = 50. But that means that only one photon in 1050 would penetrate the sample, and there are likely fewer than 1020 s-1 to start with. Thus, the dynamic range of the measurement must be specified when choosing appropriate wavelengths. Of course, a fluid sample can be diluted to allow the measurement to proceed, but that requires awareness that A <3 is desirable.
As concentrations change, molecular clusters may form, solvent structure may change, and refractive index, always a function of wavelength, may also change. Because the transmittance through an interface between media depends on the refractive index of both media, the transmitted signal depends on refraction as well as absorbance. Absorbance and refraction are connected by the Kramers-Krönig relationships,2, 3 though data reduction that employs both absorbance and refraction is uncommon. Suspended, scattering matter and refraction changes lead to baseline shifts and inaccurate measurements. In atomic absorption and IR measurements, continuum radiation from instrument components (flames, furnaces, walls) are a source of stray light. While it is common to choose a wavelength range and resolution and then hope that scattering, stray light, and refraction are constants, hope is a poor substitute for critical measurement.
The resolution required depends on the width of the spectral feature. Figure 2 shows observed absorbance compared to the absorbance in the middle of a Gaussian peak for various ratios of spectrometer width to feature width.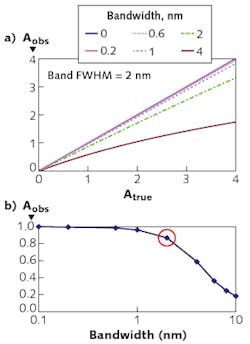
Light considerations
With too much light, absorbance transitions saturate and the amount of material is underestimated. With too little light, the measurement is noisy and results uncertain. The energy absorbed by atoms or molecules is eventually, sometimes rapidly, released. This either raises the solvent temperature, gives rise to sample phosphorescence or fluorescence, or causes photochemical reaction. The branching ratio among these phenomena is typically difficult to control and is a function of the matrix. Changes in concomitants thus can alter the estimation of the amount of the analyte of interest, even in the absence of wavelength overlap with signals from the concomitants.
Separating light into its various wavelengths, frequencies, or colors can be done in many ways. These include selection of a narrowband light source, filters, prisms, gratings, interferometers, selective detector responses, and of course combinations. Interferometers have built-in wavelength references that monitor the scanning position of their movable mirrors and, for a given aperture (ratio of optics diameter to focal length), have better resolution than grating or prism spectrographs. In the IR, interferometers give better precision than grating instruments because the major noise source is thermal noise in the detector (even when the detector is cooled) rather than in the rate of photon arrival. In the UV, the particulate nature of light sets the noise floor. In the visible, photon arrival rate can be an important limiting factor. This gives rise to frequent use of diffraction gratings and array detectors (rather than interferometers) in the UV, visible, and near-IR.
Other considerations regarding light include intensity and detection. For details on these issues (including the relationship between wavelength, photon number, signal-to-noise ratio, and detector selection), and for guidance on choosing spectroscopic instrumentation, see the second part of this article at https://goo.gl/zmUxRM.
REFERENCES
1. G. E. F. Lundell, Ind. Eng. Chem., Anal. Ed., 5, 4, 221–225 (1933).
2. B. J. Davis, P. S. Carney, and R. Bhargava, Anal. Chem., 82, 9, 3487–3499 (2010).
3. B. J. Davis, P. S. Carney, and R. Bhargava, Anal. Chem., 82, 9, 3474–3486 (2010).
Alexander Scheeline, Ph.D., is Professor Emeritus in the Department of Chemistry at the University of Illinois Urbana-Champaign and president of SpectroClick, Champaign, IL; e-mail: [email protected] or [email protected]; http://www.spectroclick.com.