Spectrometers: Spectroscopic calibration uses LEDs and nonlinear optimization
Spectroscopy is an important scientific measurement technique used to study, identify, and quantify electromagnetic radiation (light) emitted, absorbed, or scattered by materials. Variations include Raman, fluorescence, photoluminescence, laser-induced fluorescence (LIF), time-resolved, microspectroscopy, and laser-induced breakdown spectroscopy (LIBS).
What these methods have in common is the requirement to accurately identify spectral information—namely, the wavelength position and relative intensity of spectral peaks—to gain insight into chemical, physical, and biological processes.
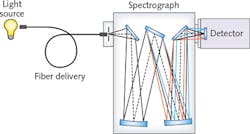
In a basic spectroscopy system, light emitted by the source is transferred into an aperture (slit), where it is collimated and directed to a diffraction grating (see Fig. 1). The grating diffracts light into discrete wavelengths that are then directed to a mirror. The mirror creates an image of the dispersed light at the focal plane in the case of an imaging spectrograph and a charge-coupled device (CCD) is positioned to detect and display intensity as a function of wavelength. And if properly calibrated, the spectroscopy system will deliver accurate, repeatable results.
To ensure optimal accuracy and repeatability for any spectroscopy instrument, Princeton Instruments developed a calibration system called IntelliCal, which features nonlinear optimization for precise wavelength calibration, a light-emitting diode (LED)-based National Institute of Standards and Technology (NIST)-traceable light source for intensity calibration, and software-driven operation.1
Wavelength calibration
Most researchers agree that a spectrometer or imaging spectrograph must include wavelength calibration for accurate and repeatable identification of spectral data. Manufacturers pay close attention to wavelength calibration during final alignment of a spectrograph and researchers perform routine wavelength calibration to ensure that a spectroscopy system is well characterized. It is one of the most widely used calibration techniques performed on spectroscopy systems.
A common wavelength calibration method requires the user to detect a spectrum, typically from an atomic emission light source such as mercury (Hg) or neon (Ne). The user identifies two or more known emission lines along with corresponding pixel positions on the CCD and then interpolates the data to fill in the gaps between the known spectral lines.
While this technique is accurate at the known wavelength positions, calibration between the spectral lines is an approximation and only precise as the interpolation method used. Driven by this limitation, our calibration tool uses the same atomic emission lines as other methods, but takes a more sophisticated approach.
Using a USB-powered light source with dual Hg and Ne lamps, IntelliCal detects the Hg or Ne spectrum, references a table of known spectral wavelengths and their relative intensities, and then derives a model based on the spectrograph's physical properties to approximate the observed spectrum. Nonlinear optimization refines the theoretical model parameters to minimize any residual differences between observed and calculated spectral intensities.
This iterative process produces a set of physical model parameters that best describes the modeled spectrograph for calibration of subsequent spectral acquisitions. This wavelength calibration is performed within our LightField spectral imaging and spectroscopy software and typically requires a few seconds to calibrate a spectrograph with 3–10X greater precision than conventional methods.2
Intensity calibration
The main objective of intensity calibration is to calibrate the y-axis, allowing the spectroscopy system to detect and analyze a sample or light source independent of the system's spectral response. NIST says, "…every instrument has a unique spectral responsivity, making both the spectral shape and absolute intensity of a single sample different on every instrument and even on a single instrument at different times".3
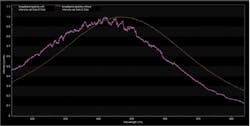
To illustrate this observation, the same light source emission was collected using three different spectroscopy systems (see Fig. 2). Without intensity calibration it is difficult to determine which curve is correct because each spectrum is the product of the light source emission and system components interacting with the beam, which might include lenses, filters, diffraction gratings, reflective surfaces, and in this case different CCD detectors.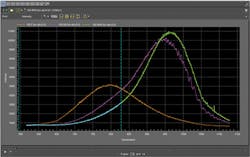
Intensity calibration is effective at eliminating the spectral response of the system from the sample data. However, it is often overlooked because of the expense and difficulty in performing this type of calibration. A typical intensity calibration system requires the purchase of a NIST-traceable quartz tungsten-halogen (QTH) calibration lamp, a regulated power supply, integrating sphere for uniform illumination of the optical system, numerous optical components and hardware, as well as available space on an optical table. And a second option developed for Raman spectroscopy applications uses NIST-traceable relative intensity correction standards based on luminescent materials.
No matter which option you choose, successful intensity calibration requires the correct system configuration, knowledge of how to perform an intensity calibration, plus some data processing on the part of the user. For example, NIST-traceable QTH light sources or luminescent standards are typically provided with calibration data in tabulated form, a radiance curve, or a polynomial expression. To calibrate a spectroscopy system, the user must interpolate and apply the calibration data against a measured spectrum to remove the system response.
Alternatively, the intensity calibration light source provided with IntelliCal is LED-based with a built-in integrating sphere, allowing automated relative intensity calibration from 400 to 1000 nm. The LED source is calibrated against a NIST-traceable lamp with calibration data stored in the light source's internal memory.
Unlike lamps, LEDs offer several advantages, including longer lifetime and improved stability of the calibration data. The rated lifetime for LEDs is approximately 40,000 hours, with recommended recalibration every 1000 hours. On average, QTH lamps last up to 2500 hours depending on the lamp design, with recommended recalibration anywhere from approximately 50 to 200 hours.
It is also possible to turn off individual LEDs within the calibration source when desired, allowing convenient elimination of unwanted second-order radiation from the calibration data, whereas QTH lamps require the addition of order-sorting filters to eliminate second-order radiation.
Software-driven calibration examples
After calibration over the wavelength range of interest, the LED light source is attached to the entrance slit of the spectrograph or positioned at the sample location. After the lamp is turned on and the temperature stabilizes, the source is ready for intensity calibration. At this stage, the user selects Calibrate within LightField to carry out the calibration process.
During calibration, the software uses the calibration data stored in the light source memory. After intensity calibration has been completed, subsequent scans are acquired with intensity calibration applied, thereby removing the system response from the sample data. The benefits of intensity calibration include correction of intensity profiles and elimination of system artifacts.
A few examples illustrate the calibration process. In the first example, five spectra are collected from the same light source with two different spectrographs, two different CCDs, and a total of five different diffraction gratings (see Fig. 3). Note the significant differences in the spectra without intensity calibration. After intensity calibration, the five spectra agree completely because the instrument response has been removed from the spectral data. With intensity calibration, it is possible to confidently share spectral data between spectroscopy systems or with other facilities around the globe.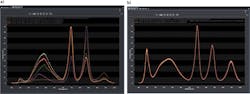
As these examples illustrate, precise wavelength and intensity calibration play an important role in spectroscopy applications. Wavelength calibration ensures that a spectroscopy system will produce accurate, repeatable results while intensity calibration allows acquisition of spectral data free from the system response.
REFERENCES
1. U.S. Patent 7,999,933, "Method for calibrating imaging spectrographs" (Aug. 16, 2011).
2. See http://bit.ly/1MhBsa4.
3. See http://1.usa.gov/1P8RMQX.
4. W. S. Hurst, S. J. Choquette, and E. S. Etz, Appl. Spectrosc., 61, 7, 694–700 (2007).
About the Author
Michael Case
Director of Spectroscopy and Thin Film Engineering, Teledyne Princeton Instruments
Michael Case is Director of Spectroscopy and Thin Film Engineering at Teledyne Princeton Instruments (Acton, MA).