Spectrometers: Super-deep-depletion CCDs optimize bio-Raman spectroscopy
For the past hundred years, Raman spectroscopy has proved to be an important tool for investigating the structure of materials and molecules. Over the past two decades, Raman spectroscopy has also received a great deal of attention from those working in the fields of biology, medicine, and the life sciences, owing to its potential to detect different classes of biomaterials and molecules, identify diseases, and serve as a diagnostic tool. Compared to other techniques in these fields, Raman methods have the advantage of achieving high molecular specificity, being label-free and nondestructive, and requiring little to no sample preparation.
Raman spectroscopy measures the wavelength shift of an excitation source, typically a laser beam, by detecting the inelastically scattered light that has shifted as the result of energy being utilized to excite vibrations in the molecules of the sample under investigation. The usefulness of Raman spectroscopy for applications relies on two facts: (a) the Raman spectrum of different molecules builds a unique fingerprint that can be used to identify a substance, and (b) the strength and position of Raman lines can be sensitively influenced by either the chemical (e.g., pH value) or physical (e.g., strain or temperature) properties of the sample.
Applications
Extensive research is being performed on applications of Raman spectroscopy. Currently, researchers in academia and industry are developing instruments to make the technique more widely available. Raman spectroscopy can be applied to a wide range of applications involved in biosensing, medical diagnostics, and treatment. It can be used for the detection of infections, the classification of cells, the monitoring of cell environment and metabolism, and the monitoring of drug delivery.1
Many applications involve medical pathology, specifically the identification of cancerous tissue, both in vitro and in vivo, and the use of the technique as a potential tool to monitor and assess the success of surgery. Raman spectroscopy has been shown to differentiate between healthy and tumorous tissue in lung, breast, digestive system, prostate, skin, and brain.
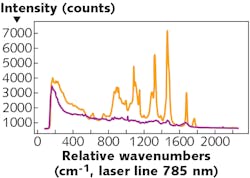
One example of the technique’s utility is the identification of different types of tissue (see Fig. 1). Different types of tissue emit Raman-scattered light with different intensities and at different wavelengths. The discrete spectral lines can be traced to specific molecular structures in the tissue’s cells, such as lipids and amino acids, down to specific molecular groups, such as C-H bonds. These Raman spectra have been extensively analyzed and tabulated.
Enhancement via SERS
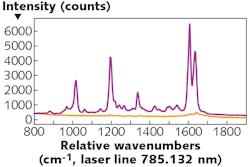
The Raman effect can be enhanced by orders of magnitude via electric field enhancement in the vicinity of plasmonic, metallic nanostructures. This surface-enhanced Raman scattering (SERS) vastly increases the sensitivity of the Raman technique and has proved useful in many biological and medical applications where Raman methods are utilized (see Fig. 2).The aforementioned nanostructures are either solution-based nanoparticles or artificially nanostructured surfaces that are capable of being combined with microfluidic devices. Moreover, SERS particles can be functionalized to refine the targeting of the technique to monitor very specific biochemicals and molecules.2
Raman instrumentation
The principal setup for Raman spectroscopic measurements is similar for all applications. A laser source is utilized to excite the Raman emission. An optical system transports the excitation light to the sample and collects the Raman emission, which is detected by a camera mounted on a spectrograph.
Optical filters are employed in the setup to distinguish the laser line from unwanted artefacts and to absorb the elastic scattered light so that only the weak Raman emission is captured in the spectrograph. Since the energy of the Raman emission is shifted relative to the excitation laser, the excitation wavelength is a critical parameter in Raman experiments, as it determines the wavelength range of the signal.
In Raman spectroscopy of tissue and in vivo observations, strong autofluorescence is emitted from the sample, overlapping the Raman signal. This phenomenon limits the observation time and increases the signal noise. Because the autofluorescence signal is significantly reduced with higher excitation wavelengths, the use of relatively high excitation wavelengths in the near-infrared (near-IR) region is favored, usually utilizing lasers emitting at 785 or 830 nm.
Typically, the optical system is matched to the application. Experiments studying cells and the inner workings of tissues use a microspectroscopy setup that can involve confocal acquisition for high spatial resolution and can be combined with scanning systems to provide hyperspectral maps of the sample.
In vivo experiments require a higher degree of flexibility and use fiber-optic probes. Fiber-optic probes are crucial elements for moving Raman spectroscopy to clinical applications. Recent literature offers a good overview of various probe designs, which strongly depend on the given application.3
Optimizing spectroscopic performance
Common to all Raman experiments is that the emission of signal is very weak. Since the Raman cross-section is reduced in proportion to the fourth power of the excitation light energy, Raman applications for the life sciences in particular require the highest level of instrument performance and system throughput. This section will discuss the experimental parameters of the spectrograph and detector that optimize sensitivity and performance.
First, it is important to optimize the light coupling and throughput of the spectrograph system. Microspectroscopy experiments typically have a low output aperture, so a mirror-based grating spectrograph is perfectly suited for these studies.
Ideally, the use of an aberration-reduced spectrograph is preferable to preserve high resolution (both spectral and spatial), increase signal-to-noise ratios (via low-aberration, high-fluence design), and permit the simultaneous detection of numerous spectral channels with minimal crosstalk. Advanced functionality like flexible scanning and multiple grating turrets can prove highly useful as well.
Optical fibers have much larger output apertures (typically f/2), so it is important to match the aperture of the spectrograph to the fiber. Lens-based spectrographs are therefore ideal for applications using fibers and fiber-optic probes. No matter the type of spectrograph, an optimized system will use optical coatings on each element to minimize system losses and maximize throughput.
Another key component of a bio-Raman system is the detector. A scientific CCD camera is often utilized to ensure the highest sensitivity. Since relatively high excitation wavelengths are used in Raman experiments for the life sciences, choosing the right detector is critical.
For example, when using 830 nm excitation, the important fingerprint and high-wavenumber regions up to 3000 cm-1 (located at 1100 nm for this excitation wavelength) are still detectable by low-noise silicon CCDs, which are unable to detect light at wavelengths above this threshold.
InGaAs detectors vs. CCDs
Although opting for even higher excitation wavelengths would further reduce the unwanted autofluorescence signal, this would necessitate the use of an indium gallium arsenide (InGaAs) detector rather than a CCD. It should be noted that while the latest InGaAs focal plane arrays deliver excellent quantum efficiency in the second near-IR window (up to ~1700 nm), they offer less-impressive noise performance and fewer array format options than CCDs.
In single-channel applications, the CCD sensor array’s height can be leveraged to increase the available signal and therefore improve signal-to-noise ratios. In vivo experiments frequently use a fiber-optic probe with multiple fiber cores that are arranged in a circular pattern on the probe’s excitation side.
While one fiber is employed to transport the excitation light, the remaining fibers cover a larger area to collect more of the Raman emission. On the probe’s spectrograph side, the fibers are redistributed to be positioned along the entrance slit to be able to maintain high spectral resolution. The spectral signal is binned in the vertical direction so the larger sum signal can be read out.
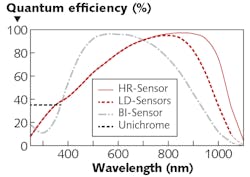
While the proven workhorse for low-light imaging and spectroscopy applications remains the traditional back-illuminated CCD, the quantum efficiency of these devices rapidly declines for wavelengths above 800 nm (see Fig. 3).Most commonly, bio-Raman applications use deep-depletion CCDs, which are designed to boost sensitivity into the near-IR range. These sensors, however, suffer from significantly higher dark current than traditional back-illuminated CCDs.
Deep, reliable cooling is therefore required to manage the resulting dark noise. Today’s state-of-the-art CCD cameras reach temperatures as low as -95°C without the use of any cooled liquids, enabling observation times of minutes or even hours. Note that special enhancement processes can also be applied to sensors to maximize their quantum efficiency and reduce unwanted artefacts, particularly the fringing effects that can appear on CCDs illuminated by near-IR light.
Super-deep-depletion CCDs
Recently, a more optimal detection solution for work in the bio-Raman field has emerged. A proprietary new class of “super-deep-depletion” CCDs made from high-resistivity crystalline silicon is now available that provides very good quantum efficiency in the near-IR range (up to 75% QE at 1000 nm; see Fig. 3).
In practice, these new sensors deliver 2–7X higher sensitivity in the wavelength range relevant for bio-Raman measurements and allow greater detection limits or shorter experiment times, depending on application requirements.4
Finally, a spectroscopy system should be easy to set up and integrate within the bio-Raman experiment. The system should afford the user fast and precise routines for spectral calibration of wavelengths and relative intensities using NIST-traceable radiometric reference light sources. The calibration routines should be simple to execute via the spectrograph manufacturer’s instrument control software.
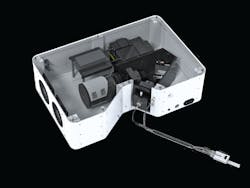
Preferred system software enables the user to orchestrate every element of the experiment, not only the setup and operation of hardware (e.g., spectrograph and detector) but the acquisition, analysis, and export of data. Easy compatibility with third-party software packages, script interfaces, and file formats should be provided.Scientists, researchers, and practitioners looking for a bio-Raman spectroscopy solution have the option to choose system components individually or to select a complete, purpose-built system. Fully integrated bio-Raman systems (see Fig. 4) should include a spectrograph, detector, laser, sample chamber, and software, as well as ports to connect optical fibers.
REFERENCES
1. Krafft et al., Phys. Sci. Rev., 4, 20170047 (2019).
2. D. Cialla-May et al., Chem. Soc. Rev., 46, 3945 (2017).
3. E. Cordero et al., J. Biomed. Opt., 23, 071210 (2018).
4. “A new dawn for NIR spectroscopy,” Teledyne Princeton Instruments white paper (2019).
About the Author
Sebastian Remi
Applications Scientist, Teledyne Princeton Instruments
Sebastian Remi is Applications Scientist at Teledyne Princeton Instruments, Acton, MA.


