Scanning spectrophotometers, capable of measuring the absorption of samples in the ultraviolet (UV), visible, and near-infrared spectral regions (180–2500 nm) are used for a wide range of industrial and scientific applications. In the analytical-chemistry laboratory they are an essential tool for both qualitative and quantitative analysis, with applications so numerous that a complete description would fill a medium-sized book. In the laser industry, these instruments play a more limited, but no less important, role in the development of new optical devices. In addition, a spectrophotometer is an essential part of any fabrication facility, because it is used to record the spectral transmission curves that are supplied with optical filters, custom mirrors, and other optical components.
Modern spectrophotometers are highly automated instruments that can be used to measure the transmission of samples in the solid, liquid, or gas phase. While early instruments incorporated one or more prisms and a large rack of analog electronics, current products are almost exclusively based on diffraction gratings and microprocessor-controlled circuitry. For routine analytical measurements, the digital control of most instrument functions results in increased ease of use and data manipulation. In some applications, however, these same functions can lead to measurement errors, making it essential for the user to fully understand the operation of the instrument.
This article describes the basic operating principles of a scanning spectrophotometer in addition to some illustrative applications. Techniques for measuring the reflectivity of optical components, the retardation of a waveplate, and the absorption of a solid-state laser crystal are outlined. Situations in which a simple, laser-based setup can yield improved accuracy at lower cost are also discussed.Absorption units
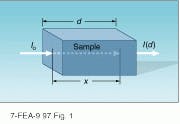
Figure 1 is a schematic representation of a typical absorption measurement in which monochromatic light, with wavelength l, is incident on a sample. Assuming that there is no reflection or scatter from the sample surfaces, the variation in intensity within the sample is described by Beer’s Law
I(x) = I0 exp(-ax)
where I(x) is the intensity at a distance x from the sample face, I0 is the incident intensity, and a is the absorption coefficient measured in units of inverse distance (cm-1 or wavenumbers, for example).
For a sample of thickness d, the transmission T and the absorption A are given by
T = 1-A = I(d)/ I0 = exp(-ad)
The optical density (OD) of the sample is a logarithmic quantity related to the measured intensities by
OD = log10 [I0 / I(d)] = log10 (1/T)
While these equations accurately reflect the physics of the absorption process, they neglect the practical reality of reflection and scatter from the sample. Because Fresnel reflections are always present and surface scatter can sometimes produce a significant loss, maximum accuracy can only be achieved by subtracting out their contribution. This process is best accomplished by measuring the transmission of a reference with reflection and scatter losses that are identical to the sample. When this is not possible, values for the Fresnel losses, calculated from index-of-refraction data, are sometimes used. In the analytical-chemistry laboratory, where liquid samples are typically contained in identical cuvettes, a sample of the solvent minus the chemical of interest is used as a reference. Errors due to power fluctuations in the input light beam can be minimized by measuring the transmission of the sample and reference simultaneously.
Photometers vs. monochromators
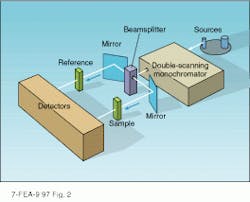
Typically, a spectrophotometer is set up to measure the absorption of a liquid sample contained in a quartz cuvette (see Fig. 2). In this device, light from a lamp is imaged through a wavelength selector that is similar in design to grating monochromators (see Laser Focus World, June 1997, p. 81). Monochromatic light passing through the exit slit of the monochromator is split into two beams of equal intensity that are imaged through the sample chamber of the instrument.The sample and reference are inserted into the two beams using a removable carriage that has provisions for mounting polarizers, apertures, filters, or other optical components. Variations in carriage design also permit the direct measurement of reflection without modifying other parts of the instrument. Light passing through the sample region is collected by detectors in each arm that are connected to the data-analysis section of the instrument.
To cover the UV, visible, and near-infrared spectral regions, multiple gratings and lamps are housed within the instrument. For example, a deuterium lamp is typically used to produce UV radiation, while a tungsten-filament lamp covers the visible and near-infrared wavelengths. The grating and detector are also changed in the near-infrared, thereby maximizing the sensitivity and resolution of the instrument throughout its operating range.
The spectral resolution is ultimately determined by the slit width of the scanning monochromator and the groove density of the grating. Accuracy is achieved by illuminating the detectors with an adequate amount of light and minimizing stray light within the sample chamber. In the case of liquid samples, the spectral features are broad, and the sample transmission can be adjusted by varying its concentration. Coated optical components also have broad reflection bands, although the amount of transmitted light is fixed by the coating design. In both cases, a programmed instrument function that adjusts the slit width to maximize the accuracy of the transmission measurement is optimal. In other situations in which it is more important to maximize the spectral resolution of the instrument, the slit width must be adjusted manually.
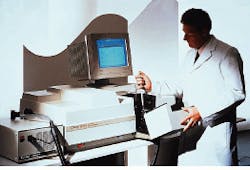
Modern instruments have programmable control functions that allow one to vary the rate at which the wavelength is scanned and the way in which the sample absorption is recorded (see photo at top of this page). In all cases, the absorption of the sample is calculated by comparing the power measured in the sample leg to that of the reference. Electronics or software within the spectrophotometer are used to convert the raw data to a more usable form—typically the variation of transmission or absorption with wavelength over a specified interval.
Characterizing laser crystals
In addition to routine analytical tasks, scanning spectrophotometers are often used to measure the absorption of solid samples. In the laser laboratory, the absorption spectrum of a new material can be related to a number of important properties, and it is an essential in the characterization of any new laser crystal. Both the strength and position of the absorption bands are important in determining whether a new crystal can be pumped by flashlamps, diode lasers, or other laser sources.
Typical spectroscopic samples are 1–2 mm thick, with a cross-sectional area determined by the dimensions of the grown crystal. In those cases in which the sample cross section is small, apertures within the spectrophotometer are used to reduce the diameter of the incident beam. Typical samples are ‘window-polished’ so that both surfaces are transparent. If an undoped sample of the crystal is available, it is often used as a reference, otherwise a knowledge of the index of refraction for the crystal is used to determine the light lost by Fresnel reflection.
If the crystallographic orientation of the spectroscopic sample is known, it is often desirable to measure the polarized absorption spectrum. This measurement is accomplished by inserting polarizers in both the sample and reference legs of the instrument and orienting the crystal in such a way that the polarization of the transmitted light is parallel to one of the axes.
In recording the absorption spectrum of a crystal sample, the determination of line width is much more important in maximizing the accuracy of the absorption measurement. As a result, it is necessary to manually set the slit widths in the instrument. Otherwise, the slit width is automatically adjusted during the spectral scan so that an optimum light intensity falls on the detector. While important for accurately determining the concentration of liquid samples, this function generally leads to a broadening of the actual absorption lines.
Commercial optics vendors supply data
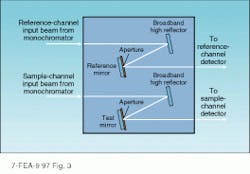
Outside of the research laboratory, scanning spectrophotometers are commonly used for the characterization of optical components. Depending on the optic, the sample chamber can be configured to directly measure either reflectivity or transmission (see Fig. 3). To determine the reflectivity of an antireflection-coated surface, identical high-reflectivity mirrors are inserted in both the sample and reference legs, allowing the measurement beams to be reflected from an unknown (reference) surface before entering the detector. In the reference leg, an uncoated fused-silica plate is used as a standard. A high-quality surface polish is used to reduce scatter to an insignificant level, and its reflectivity is calculated from the index of refraction. In the sample leg, the zero-reflectivity point is determined by completely removing the optic from the setup. The reflectivity of an unknown sample is determined by placing it behind the aperture and scanning the instrument over the wavelength range of interest.While direct transmission measurements are subject to errors caused by scattering and absorption in the coating, many vendors use them to determine the reflectivity of laser mirrors. This approach is justified by the lack of a reflectivity reference having a known value over an extended wavelength range.
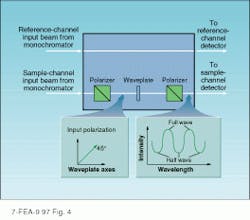
Spectrophotometers also can indirectly measure other optical properties. Examples include the determination of the retardation and order of a waveplate (see Fig. 4). In this application, two polarizers, aligned for maximum transmission, are placed in the sample arm of the spectrophotometer, one before and one after the sample holder. The unknown waveplate is placed between the polarizers with its principal axes oriented at 45 to the polarization of the incident light. At wavelengths at which the waveplate retardation is a integral multiple of l, the polarization of the light will not be affected and the transmitted intensity will be maximized. At other wavelengths, where the retardation is an odd multiple of l/2, the polarization is rotated by 90 and the transmission is minimized. By recording the trans mission function of the polarizer/ waveplate combination, it is possible to determine the wavelengths at which the optic is a half- or quarter- waveplate. In addition, the distance between peaks can be use to determine its order.Dedicated testbed offers benefits
While scanning spectrophotometers are suitable for a wide range of measurements, the complexity and cost associated with broad spectral coverage and advanced data analysis is disadvantageous in some quality-control and assurance applications. In cases in which it is necessary to measure the transmission/reflectivity of a large number of identical optics at a single wavelength, the construction of a laser-based fixed-frequency testbed embodying the basic principals of a two-arm spectrophotometer may be justified.
By substituting a low-power, semiconductor or diode-pumped solid-state laser for the scanning monochromator, it is possible to construct a dedicated testbed that is reliable and easy to operate. In addition to reducing the cost of the measurement, setups of this type are generally more accurate than scanned instruments. Furthermore, the availability of semiconductor and solid-state laser sources that combine small size with amplitude stability and long lifetime makes this option increasingly attractive.
Whether scanned instruments or fixed-frequency testbeds are used, a two-arm absorption measurement can provide a wealth of useful information. As in the past, the development of new commercial instruments will be driven by analytical chemists, with the optics community adapting them in ways that take full advantage of their capabilities.
