Approach involving fluorescence labeling improves accuracy in genomic mapping
If an original genomic map obtained through next-generation sequencing involving polymerase chain reaction (PCR) contains any amplification biases, there is room for systematic error across studies. Recognizing this, a team of researchers at the University of Minnesota (Minneapolis, MN) and BioNano Genomics (San Diego, CA) have improved a nanochannel-based form of genomic mapping by using dynamic time-series data to measure the probability distribution, or how much genetic material separates two labels, based on whether the strands are stretched or compressed.
Related: Laser fluorescence powers sequencing advances
"Imagine that two labels on the DNA backbone are connected together by a spring that models the configurational entropy of the DNA between them," says Kevin Dorfman, a professor in the University of Minnesota's College of Science & Engineering. "If this was a harmonic spring ... then we would expect to see an equal probability of positive and negative displacements about the rest of the length of the spring."
Rather than this normal curve, however, Dorfman and his colleagues observed greater compression than extension between the labels, and found that the the majority of thermal fluctuations between the labels are short-lived events—information that could help improve the accuracy of genome mapping.
"Such improvements are especially important for complicated samples like cancer, where the cells are heterogeneous, so we need high accuracy to find rare events," Dorfman says.
Dorfman and his lab have been working with collaborators at BioNano Genomics over the past three years, through grants supported by the National Institutes for Health and National Science Foundation.
A problem the researchers encountered with the traditionally used pulsed field gel electrophoresis method—in which genome maps are constructed by dicing DNA sequences with restriction enzymes—lay in reassembling the maps, as the conventional process sorts the fragments as a function of their size. In the nanochannel method, however, the fluorescent labels stay ordered on each chain throughout. This allows the researchers to determine the content of the entire strands from their fluorescent barcodes, without having to reassemble them—removing the reliance on a previously obtained map.
The researchers started by labeling the DNA, which consisted of extracting the genomic DNA from E. coli cells, removing a single nucleotide and piece of the backbone at various targeted locations, and inserting fluorescent nucleotides in their places. Each DNA strand, typically around 300,000 base pairs, was then injected into a 45 nm-wide nanochannel. This forces the molecule to stretch since the bending length scale for DNA, at which it still moves in a rod-like, quantifiable manner, is about 50 nm.
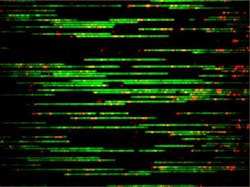
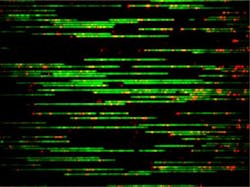
They then imaged the location of the labels using a digital camera. Whereas typical single-molecule studies of DNA in nanochannels report the statistics from dozens of molecules, the researchers' method involves thousands of molecules, each covered in a flurry of labels—leading to millions of measurements of distances between the labels, which are essential to determining the probability distributions.
Future work for Dorfman and his colleagues includes using these distributions as an input into the genome mapping algorithm. This can be used to assign a confidence that a particular sequence of dots maps to a particular region of the genome, as well to help understand the effect of the knots, folds, and loops of the stretched DNA on genome mapping.
Full details of the work appear in the journal Biomicrofluidics; for more information, please visit http://dx.doi.org/10.1063/1.4938732.
Follow us on Twitter, 'like' us on Facebook, connect with us on Google+, and join our group on LinkedIn

