SPECTROSCOPY/MICROSCOPY: Nonlinear Raman microscopy eyes clinical application
Nonlinear Raman microscopy is an emerging technique in biomedical imaging. An inexpensive prototype system, based on coherent anti-Stokes Raman scattering (CARS), demonstrates value for real-time, minimally invasive chemical analysis of cells and tissues. It overcomes drawbacks of both Raman and CARS, and in doing so demonstrates potential for clinical application–including blood analysis and breast cancer detection.
By V. V. Yakovlev
Spectroscopy provides quantitative and chemically specific analysis of cells and tissues in a truly non-invasive way. Raman scattering of light by molecules can reveal vibrational and rotational modes, for example–but while Raman microspectroscopy has seemed a promising tool for bioimaging, its weak signal strength and background fluorescence are major obstacles to generation of unambiguous results in real time.1 Recently, though, improved acquisition speed has drawn significant attention to nonlinear Raman microspectroscopy.2
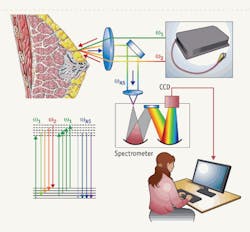
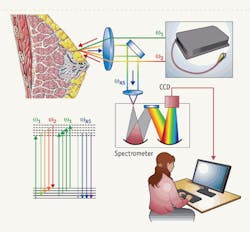
FIGURE 1. This simple, inexpensive CARS microspectroscopy system allows real-time broadband spectral acquisition and unambiguous results. (Diagram of breast is adopted from the NIH web site, www.nlm.nih.gov/medlineplus/ency/images/ency/fullsize/17185.jpg.)
While the specificity of Raman spectra is heralded, it is somewhat exaggerated. Raman spectra of many complex organic molecules contain similar sets of molecular vibrations, which differ mainly in terms of amplitude. Thus, imaging a sample at a single vibrational line may not always provide sufficient chemical information. In such cases hyperspectral imaging (i.e., with full vibrational spectrum recorded at each point in space and time) is more suitable. This limitation suggests the use of broadband coherent anti-Stokes Raman scattering (CARS).
CARS spectroscopy is a variation of a four-wave mixing spectroscopy, in which the signal wavelength is generated at the frequency
ωCARS = ω3 - (ω1 - ω2).
where ω1 and ω2, and ω3 is the frequency of pump, Stokes, and probe pulses, respectively.
Achieving broadband CARS imaging requires broadband excitation–so that all the vibrational levels of interest (100 cm-1–3500 cm-1) are excited–and a narrowband probe pulse, which defines the spectral resolution of CARS measurements. The pulses must overlap in space and time on the sample. As a result, the approach enables fine spatial resolution.3
System overcomes CARS limits, too
At the same time, though, CARS introduces another restriction that initially complicates measurements. Because CARS is a nonlinear optical process, high-intensity laser pulses are required for efficiency. But biological tissues are vulnerable to high-intensity light radiation, so to maintain non-invasiveness, one must use radiation in the near-IR spectral region (900–1500 nm), where the multiphoton damage to live cells is somewhat minimized.4-5
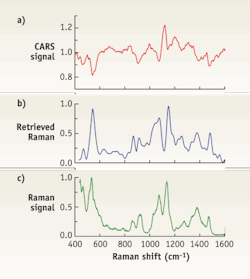
FIGURE 2. Three traces show (a) CARS spectrum, (b) retrieved Raman spectrum, and (c) experimentally measured Raman spectrum from a 150 mg/dL solution of glucose. The retrieved Raman spectrum shows a very good correlation with the measured one.
To overcome these constraints, we have devised a very simple CARS microspectroscopy system that allows broadband spectral acquisition and does not require day-to-day alignment (see FIGURE 1). By using the fundamental output of the Nd:YVO4 laser, which is now being replaced with a fiber laser (Polaronyx Inc.), as the pump and the probe radiation; and by using a broadband continuum generated in a special optical fiber (we used Ge-doped fibers, which generate an extremely strong red-shifted continuum in the spectral region from 1000 to 1500 nm) as the Stokes pulse, we achieved an intrinsic synchronization of all the participating laser pulses, while maintaining minimal invasiveness for biological tissues. And the use of radiation in the near-IR spectral region promotes deeper penetration inside a tissue, which is advantageous for many applications.
CARS spectroscopy benefits from the coherent excitation of the vibrational state of a large number of molecules. To achieve this quantity of excitation molecules, one must increase either the concentration of molecules (for example, lipids are rich in CH2 bonds, and any object composed of densely packed lipids will have an extraordinary strength of CARS signal) or the excitation volume. Our approach focuses on achieving fast chemical imaging over a large tissue sample. We accomplish this by expanding our excitation volume to up to several microns in diameter while keeping the incident intensity the same. This requires substantial incident pulse energy, but a MHz-rate laser system is routinely capable of providing this energy density level. As a result, we can achieve spectral acquisition with an exposure time as short as 1 microsecond.
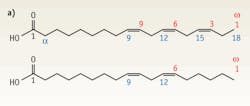
FIGURE 3. (a) The chemical structure of alpha-linolenic acid (omega-3 fatty acid) at top differs only slightly from that of the linoleic acid (omega-6 fatty acid) structure. (b) The measured Raman and retrieved CARS spectra of linoleic (omega-6) acid correlate nicely, as do the (c) same measurements of alpha-linolenic (omega-3) acid.
The only other problem remaining for CARS imaging is the presence of a non-resonant background originating from a number of different molecules in the excitation volume. This results in complex line-shapes, which are not always convenient for interpretation. However, those complex spectra can be converted to traditional Raman spectra using a number of existing algorithms to produce retrieved spectra.6-7 For instance in an experiment that measured both CARS and Raman spectra in the same solution of glucose (150 mg/dL), the only difference between the measurements was duration of the reading: It took 1s to acquire the CARS spectrum and 100s for the corresponding Raman spectrum acquisition. The retrieved Raman spectrum correlates well with the experimentally measured one, considering a huge difference in the excitation wavelength (see FIGURE 2).
Blood analysis and other applications
Clearly, CARS microspectroscopy allows identification of chemical compounds in the blood, as has been done earlier with conventional Raman spectroscopy, but it provides better spatial discrimination and significantly better signal-to-noise ratio.8 This opens a wide window of opportunity for real-time, truly non-invasive chemical assessment of the patient's blood, which, in particular, is highly desired for successful insulin therapy for diabetes mellitus management.
Several other potential applications are based on the ability to provide accurate spectral information much faster than conventional Raman can, and often avoiding an unnecessary interference from out-of-focus tissues.9
Many biological molecules have very similar chemical structure, but are dramatically different in their properties and their effect on a living organism. One of the most striking examples is related to fatty acids. There are two major types of fatty acids, commonly called omega-3 (unsaturated) and omega-6 (saturated) fatty acids. Their chemical structure is different only by a single double carbon bond for alpha-linolenic (omega-3) and linoeic (omega-6) fatty acids (see FIGURE 3a). However, both Raman and retrieved CARS spectra show a substantial difference between the two (see FIGURE 3b and 3c). Clearly, both techniques display their promise in distinguishing these fatty acids based on their vibrational spectra; however, CARS microspectroscopy allows those measurements to be performed on a time scale not achievable for Raman spectroscopy.
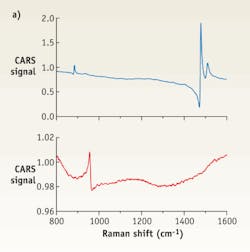
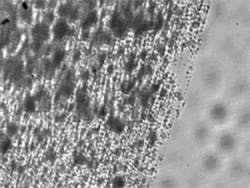
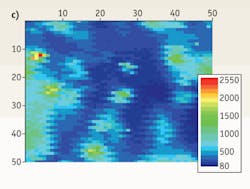
FIGURE 4. (a) CARS spectra distinguish two types of breast tissue microcalcification: the harmless calcium oxalate (top) and malignancy-associated calcium hydroxyapatite (bottom). (b).While bright field optical imaging of microcalcifications on a glass slide cannot distinguish between the types, CARS can. CARS imaging shows distribution of (c) COX and (d) HAP microcalcifications.
In the last example, we consider the possibility of breast cancer detection. In particular there is a growing interest in chemical analysis of microcalcifications, which are typically detected in X-ray mammograms. These calcifications are not necessarily associated with cancer, but sometimes their presence indicates a pre-cancerous condition. Extensive research has shown that there are typically two types of those microcalcifications. The first type, calcium oxalate (COX) is considered harmless, while the second type, calcium hydroxyapatite (HAP), is often associated with breast tissues that later show malignancy. The two chemical species can be easily distinguished by their vibrational CARS spectra, and the signals are extremely strong because of the high local concentration of calcifications in microscopic formations and strong Raman lines (see FIGURE 4a).
To test the ability of CARS microspectroscopy to distinguish those two chemicals in the same volume, we prepared a mixture of those calicifications on a glass slide and collected CARS spectra from a selected area of the sample. A bright-field optical image proves, not surprisingly, incapable of seeing and discriminating calcifications (see FIGURE 4b). However, vibrational spectral images, being collected either for a characteristic Raman line of HAP or COX, display a different spatial distribution of those microcalcifications on a slide (see FIGURES 4c and 4d). Those measurements can be performed both with Raman and CARS systems, but a superior CARS signal performs the task more than 1000 times faster.
Compatible with other approaches
The broadband CARS microspectroscopy system we designed and tested is inexpensive, reliable, and includes no moving parts. It can easily collect the whole CARS spectrum from 500 to 3500 cm-1 in high spectral resolution within microseconds. The system can be easily adapted for fiber-based delivery system, and it is compatible with other optical imaging modalities, such as optical coherence tomography (OCT) and photoacoustic imaging, while providing complementary, chemically specific information about the selected tissue volume. The advanced methods of spectral retrieval allow fast signal processing, which leads to the acquisition of background-free vibrational spectra with very high signal-to-noise at least 1000 times faster than it is currently possible with the state-of-the-art Raman imaging systems.
This work was supported by NIH grants R03-EB008535, R21RR016282, and R21RR014257 and UWM-RGI grant.
References
- E. B. Hanlon et. al., Phys. Med. Biol. 45, R1-R59 (2000).
- V. V. Yakovlev, Ed., "Biochemical applications of nonlinear optical spectroscopy," CRC Press, Boca Raton, 2009.
- W. Denk et. al, Science 248, 73-76 (1990).
- J. M. Squirrell et al., Nature Biotech. 17, 763-766 (1999).
- V. V. Yakovlev, J. Raman Spectroscopy 34, 957-964 (2003).
- V. Lucarini et. al., "Kramers-Kronig relations in optical material research," Springer, Heidelberg, 2005.
- G. I. Petrov et. al., Proc. Natnl. Acad. Sci. USA 104, 7776-7779 (2007).
- A.J. Berger et. al., Appl. Opt. 38, 2916-2926 (2002).
- R. Arora et. al., J. Mod. Opt. 55, 3237-3254 (2008).
V. V.Yakovlev is professor of physics, University of Wisconsin–Milwaukee, www4.uwm.edu/letsci/physics/staff/vladislav_yakovlev.cfm; [email protected].
More Brand Name Current Issue Articles
More Brand Name Archives Issue Articles
