MEASUREMENT STANDARDS/SUPER-RESOLUTION MICROSCOPY: Quantifying fluorescence
EMCCD technology, which revolutionized the life sciences by enabling visualization of low-light events, is quantitative. But EMCCD's standard unit of measure is variable. A non-arbitrary alternative promises better fluorescence microscopy–and better science.
By Deepak Sharma
Intracellular microscopy. Raman spectroscopy. Whole-animal in vivo imaging. These and other low-light applications have empowered life scientists ever since they were made possible. What made them possible was the introduction of electron multiplying charge coupled device (EMCCD) technology.
EMCCDs are the most sensitive CCDs available. EMCCD cameras operate by boosting the incoming photonic signal well above the camera noise floor–effectively making the read noise less than one electron. With all CCD cameras, incident photons generate photoelectrons. In an EMCCD, photoelectrons are then sequentially moved from pixel to pixel in an extended register using high voltages. This high-voltage-induced movement of the charge results in impact ionization events, multiplying single photoelectron(s) into many. Electron multiplication enables sensitivity to the single fluorophore.
How quantitative?
In both EMCCD and CCD-based cameras, imaging data are measured in analog-to-digital units (ADUs, also known as gray-scale or fluorescent units). But while EMCCD.com reports that "EMCCD is a quantitative digital camera technology," ADUs are merely electronic representations of the number of incident photons. The way in which a camera makes this representation is variable–not only among different types of cameras, but also among individual units of the same make and model. The myriad of available camera settings can also affect the value of the produced ADU. The uncertain nature of the current unit of measure limits researchers' ability to control for experimental variability. Therefore, reproducing imaging experiments–even in the hands of the same researcher–is often elusive.
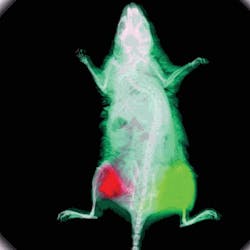
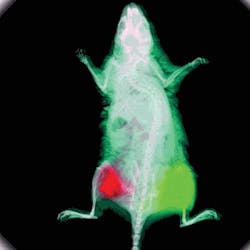
FIGURE 1. Human skin fibroblasts (HSFs) transfected with prominin-2 GFP, are shown expressing the GFP differently. Without quantitative, reproducible units, deciding which one should be the control is difficult: A medium intensity cell this round may not be the same as a medium intensity cell in the next round? (Image courtesy Raman-Deep Singh, Mayo Clinic, Rochester, MN)
Why are ADUs arbitrary? The amplification of incident photons to observed pixel values is impacted by many factors, including variable gain settings, sensor aging, and camera-to-camera differences in sensitivity and bias (or offset) settings.
EM gain multiplies the incoming signal to detectable levels. However, actual applied gain levels can often diverge from the indicated multiplication selected by the user. Manufacturers most often do not report exact values, so the gain factor setting may actually be somewhat different from what a camera provides. For some older camera designs, the applied multiplication also might not scale linearly, such that a gain setting of 800X does not produce twice the signal as that of 400X. This all means that the gray levels assigned in the produced image can diverge from the actual incoming photons that they represent.
In addition, some EMCCD chips lose EM gain over time. The camera that once had a true measured EM gain of 400X will not have the same gain when put at the same setting as weeks pass. Thus, an equivalent number of photons can produce a different observed response in ADUs as the camera is used.
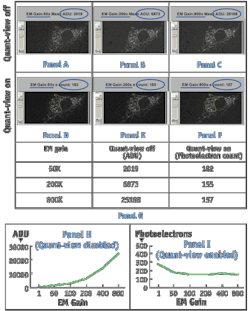
FIGURE 2. Results of imaging a low-light cell sample with immunofluorescently stained Golgi apparatus with a Photometrics Evolve 512 EMCCD camera. With Quant-View technology–which quantifies imaging data in photoelectrons–disabled (panels A to C), reported fluorescence signal increased with greater applied EM Gain. With Quant-View enabled (panels D to F), fluorescence signal reported in photoelectrons remained stable with increasing EM gain. Average pixel data from panels A to F are tabulated in panel G; average pixel data from images taken at six different EM gain settings is graphed in panels H and I.
When the EM Gain level applied is low, the photoelectron count is a little higher in Quant-View mode (column 3 of panels G and I) because adequate EM gain has not yet been applied to effectively reduce the camera read noise to sub-electron levels.
When not corrected for, these variables confine the meaning of an ADU to a single camera's behavior at a single point in time.
Control errors
The ambiguous meaning of the ADU significantly hinders the isolation of error sources present in imaging experiments. Using ADUs, researchers are without means to verify that controls between experiments actually behave equivalently. Without such affirmation, researchers might unintentionally compare systems with different behaviors.
For example, a component common to several types of imaging experiments, antibodies, can introduce a source of error. Scientists use antibodies to attach fluorescent reporters to molecular targets under investigation. Antibodies can be repeatedly removed from and returned to freezers during the course of multiple imaging experiments. Successive freeze-thaw cycles can denature the antibody, thus reducing its binding efficacy and changing the behavior of the fluorescent reporting system. Researchers will open fresh antibody aliquots, but sometimes only after noticing samples that were bright at a certain camera setting are now better visualized at higher settings. The slow aging of the antibody has changed the properties of the experiment over time.
Cells transfected with fluorescent proteins are also useful for many diverse types of studies. However, transfection efficiencies often vary from cell to cell. Under or over-expression of fluorescent proteins can introduce experimental artifacts, change molecular behaviors, and modify intracellular distribution. Likewise, fluorescent dye uptake can vary cell to cell. This also can lead to another source of error and inconsistencies in scientific observations.
Without controlling for variation between the controls of different experiments, conclusions drawn from comparing such experiments are potentially prone to error (see Fig. 1). Reporting imaging data in absolute, quantitative units lays the foundation for researchers to more completely control for experimental variation. This makes imaging experiments reproducible and more easily comparable between different imaging systems and personnel.
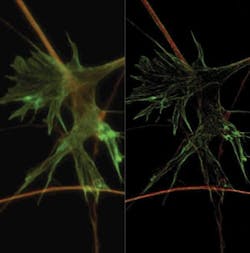
FIGURE 3. This fibroblast cell, triple-stained with DAPI, FITC-Actin, and Mito-Tracker, was imaged with the Evolve camera and Olympus DSU confocal microscope. The image benefits from a customizable feature, called "background event reduction technology" (BERT), which reduces the spurious noise events inherent in FPALM imaging. BERT operates in real time, making the acquired imaging data clearer and more amenable to analysis. (Image courtesy Graham Dellaire, Dalhousie University, Halifax, Nova Scotia.)
Of course, researchers can manually calibrate their current cameras to align reported ADUs with actual incident photons. But the process requires a high-level of knowledge, specialized equipment, and effort. This includes measuring the device's response to light using a flatfield illumination source with intensity control to effectively titrate the amount of photons hitting the sensor. Using data from such a system, it is then necessary to perform mean and variance calculations to generate a response plot to provide the camera's gain value in electrons per ADU1. Using an EMCCD camera requires the collection of additional data to calculate the camera's actual EM gain, a factor that effectively changes the electrons per ADU.
Characterizing the actual applied EM gain requires acquiring images with EM gain applied (using low-intensity illumination) and without EM gain applied (with higher-intensity illumination).2 This EM gain value (which is purely a multiplicative factor) can be combined with the camera gain value to determine the total camera system gain (in electrons per ADU). This number allows the researcher to convert the ADUs provided by his/her camera into photoelectrons.
When using EMCCD devices that undergo EM gain aging, the process may need to be repeated for each experiment, as the EM gain multiplicative factor can change with camera usage. Given the length and complexity of the whole process, it is easy to understand why few life scientists characterize their cameras.
The photoelectron
A simple way to achieve standardized imaging data is to measure the number of photoelectrons that are generated by photons hitting the camera sensor. A novel re-engineering of EMCCD camera technology has now enabled researchers to use the photoelectron as the standard measurement in imaging experiments without the need for manual technology expertise, back calculations, or additional equipment.
The Evolve EMCCD camera (Photometrics, Tucson, AZ) is designed to automate the necessary calibrations, calculations, and real-time measurements to determine the exact gain and bias (offset) values of the camera, allowing it to report measurements in photoelectrons. The camera's Rapid-Cal feature performs the characterizations and calculations outlined above, and adjusts the high voltage settings in the electron multiplication register to calibrate the camera's EM gain output to match the multiplication requested by researcher.
Measurements occur in real time so there is no impact on the timing of experiments. By standardizing the unit of measurement, the technology allows researchers to compare, in absolute terms, images taken at different times and gain settings (see Fig. 2).
According to Sidney L. Shaw, assistant professor in the Department of Physics at Indiana University, "The Evolve camera finally gets rid of arbitrary gray levels in favor of photoelectron counts, a meaningful standard that scientists can use for comparing their imaging systems and their image-based data."
Absolute units enable researchers to get a more complete understanding of their experimental system and to optimize experimental protocols. For example, if a secondary antibody is being used in immuno-fluorescent labeling, an antibody titration will reveal the optimum concentration required for the best imaging results. If such data is being collected using a standardized unit of measurement, such as the photoelectron, then there is little chance of error. By contrast, data collected in ADUs would be easily and inadvertently altered by different camera settings, making optimization of experimental protocol more error prone. If an antibody becomes less efficient in binding, a user may simply move a camera gain slider upward to obtain ADU values equivalent to the last measurement and proceed with the experiment assuming little has changed. Researchers using standardized photoelectron units can be more confident in their experimental setup and the data gathered, and reduce potential for reporting statistically insignificant findings.
Alex Rodriguez, assistant professor of Cell Biology at Rutgers University, used the objectivity of the produced imaging data to standardize his lab's protocols. "Quantification is critical because students in my lab produce different answers from the same experiments, over and over again," said Rodriguez. "This kind of instrument really is the solution to getting reproducible experimental data in the lab. I know that years from now when I have new graduate students and, maybe, a new microscope and camera, I can confidently reference previously generated data."
Impact example: Microscopy
Super-resolution fluorescence microscopy–including modalities such as Fluorescence Photoactivation Localization Microscopy (FPALM) and 3D structured illumination microscopy (3D SIM)–have broken the "diffraction barrier" and now allow researchers to see subcellular structures only tens of nanometers apart.
The former, FPALM, leverages the unique properties of genetically encoded photoactivatable fluorophores. Successive flashes of light of a specific wavelength stochastically activate subsets of fluorophores, which each emit a photon at a different wavelength a nanosecond later. Because fluorophores are tagged to structures of interest, those flashes reveal the locations of target molecules. Super resolution is achieved by triangulating the centroid of each molecule from the photon distribution patterns formed by overlaying images of successive flashes.
Analyzing photon distribution patterns is also essential for 3D SIM, a novel approach amenable to fast, multi-wavelength, live-cell imaging. The sample and an illuminating interference pattern interact to cause fringe patterns from which computational reconstruction can reveal tiny structures.
The accuracy of FPALM and 3D SIM images depends on extremely minute variations in pixel intensity. Quantitative data capture precisely defines pixel intensities and removes ambiguity in measurements. Imprecise data capture could lead to inappropriate assignment of gray levels to photon values. For the analysis, using higher quality data that distinguish locations of light sources increases localization accuracy and enables better science (see Fig. 3).
The power of precision
The challenges of achieving reproducibility in measurement are not unique to imaging. The journal Science retracted a "Breakthrough of Year 2005" article because of unclear reporting of quantitative real-time PCR data.3 The lack of standards for reporting qPCR data spurred a coalition of academics and major equipment manufacturers to define and publish guidelines for minimum data reporting standards.4
Proteomic studies are also affected by unclear reporting standards. Experiments conducted under the auspices of Human Proteome Organization (HUPO) demonstrated that without standardized handling and analysis, labs using identical samples found different sets of biomarkers.5
Likewise, implementing standards for reporting imaging data, starting with an absolute unit of measurement, will increase the potential for reporting statistically significant results and boost confidence in the reliability of those results.
Quantitative measurement is a fundamental principle of science. For imaging applications, standardized units of measurement hold great promise including the abilities to:
- verify behavior of controls between experiments,
- reproduce imaging experiments and share data among research groups, and
- directly integrate data from different experiments and leverage them to enable new insights.
References
- Photometrics' mean variance calculator and whitepaper, www.evolve-emccd.com/calculators/meanvariance.php.
- Calculating electron multiplication gain, www.photomet.com/learningzone/calculatingelectronmultiplicationgain.php.
- H. Bohlenius et al., Science, 316:367 (2007).
- S. Bustin et al., Clin. Chem. 55, 611-22 (2009).
- T. Addona, et al., Nature Biotechnology 27, 633–641 (2009).
Deepak Sharma, PhD, is senior product manager, Photometrics, www.photomet.com, [email protected].
More Brand Name Current Issue Articles
More Brand Name Archives Issue Articles


