SPECTROSCOPY/FORENSICS: CSI: Multidimensional Raman spectroscopy
VITALI SIKIRZHYTSKI, ALIAKSANDRA SIKIRZHYTSKAYA, and IGOR K. LEDNEV
Editor’s note: This article is based on the paper by V. Sikirzhytski, A. Sikirzhytskaya, and I.K. Lednev, Appl. Spectrosc., 65, 11, 1223–1232 (2011).
The analysis of body fluid traces during forensic investigation is critical for determining the key details of a crime. Ideally, analysis methods are confirmatory, nondestructive, and applicable to multiple fluids. But no methods currently in use meet these criteria: Standard biochemical tests are typically destructive and require hazardous chemicals as well as specialized skill—and none works to analyze all body fluids.1,2
Raman spectroscopy, however, has shown potential for rapid, nondestructive, and confirmatory identification from specimens as small as a few femtoliters or picograms without preparation.3 It is at the basis of a novel, universal approach for analysis of forensic evidence.
Offering spatial resolution of about one micron or less—approximately 10 times that of mid-infrared (mid-IR) spectroscopy—Raman microspectroscopic mapping and imaging is relatively easy with the help of an automated stage. Additionally, portable instrumentation enables on-the-spot analysis of drugs, bones, fingerprints, and body fluids.1, 2, 5-18
Twist on a proven standard
Standard methods used to identify unknown samples are usually based on the detection of characteristic Raman bands in the recorded experimental spectrum or comparing the experimental spectrum, as a whole, with spectra from a reference database. While these approaches have their place (they are widely useful in the process industries, for instance), our studies show intrinsic heterogeneity of body fluid stains, with multiple overlapping of Raman bands and variable fluorescent backgrounds (contamination and substrate type can also interfere with the analysis of unknown samples). A novel approach we have developed combines Raman spectroscopy with advanced statistical methods and uses multidimensional Raman spectroscopic signatures to overcome complications of the standard approach and to minimize false-negative and positive results.12-15, 18
A multidimensional spectroscopic signature is a set of spectra that represent key characteristic variations of the specimen.1,16 An experimental spectrum can be presented as a linear combination of these components—that is, as a point in space at which the coordinates are equal to the contributions of the corresponding spectra. Identifying an unknown object involves searching for the best match between the available multidimensional signatures and the experimental data.
Each of the signatures has been designed to cover the intrinsic variability of heterogeneous samples and the variability between samples. In this way, the probability of false-negative results is minimized. The probability of false-positives can be controlled using statistical parameters from signature fitting: If the residuals of such a fitting are too large, then the specimen will be interpreted as being yet unidentified.
The Raman approach and biological samples
Raman spectroscopy is based on the inelastic scattering of laser light through its interaction with vibrating molecules.19 Ultimately, Raman spectra provide information regarding molecular chemical structure, molecular conformation, interactions between molecules and the surrounding environment, and the physical state and condition of matter.
Raman spectra can be very complex and contain broad and superimposed Raman bands.20-23 This is especially true for biological samples, which often include spectral features of multiple constituents: Proteins, lipids, DNA, RNA, individual amino acids, biological chromophores (heme, carotenoids, and melanin), and other metabolites. In such cases, the extraction of useful information requires significant effort, such as the application of comprehensive chemometric methods.
Raman spectroscopy uses a variety of laser sources that provide excitation in a wide spectral range covering ultraviolet, visible, and infrared (UV-VIS-NIR). The approach is not limited by physical state, and can be performed on gaseous, solid, liquid, gelatinous, nontransparent, and heterogeneous samples with complex chemical compositions. Recent studies have demonstrated that under certain conditions (resonance and surface enhancement), it can be performed even at the single-molecule level.24
Raman spectroscopy’s two main disadvantages are 1) the weakness of the Raman effect in the absence of resonance and surface enhancement, and 2) the potential for fluorescence interference. The probability of the Raman effect is just about 10-6–10-9 per incident photon, which imposes the need for sensitive and optimized light detectors. It is possible to minimize fluorescent contributions using time- or space-resolved Raman spectroscopy or by using numerical methods to eliminate fluorescent background from previously recorded Raman spectra.
Two- and/or three-dimensional spectroscopic mapping allows efficient collection of data from intrinsically heterogeneous samples. Typically, acquiring Raman spectra involves moving the sample in a stepwise manner until the entire region of interest is characterized. Modern equipment provides settings for mapping measurements, such as spectral acquisition from a rectangular or circular area (filled or focal point review outlined), a line, a point, or a depth slice. Therefore, each spectrum represents a specific area of the specimen.
Several approaches enable treatment of spectroscopic data sets: It is possible to create various types of maps by using direct analysis of the data, curve fitting, or pretreatment; and to develop topology, component, principal component analysis (PCA), and multivariate curve analysis maps.4,25,26
The challenge of unknown samples
Numerous statistical methods can help to solve the common problem of identifying unknown species. The application of multidimensional signatures, described here, shares certain similarities with the problem of mixture analysis. The local composition of a heterogeneous stain can be treated as a mixture of several basic components. Relative concentrations of such components may vary significantly within the sample, but the list of components under consideration is limited. A multidimensional spectroscopic signature of a body fluid must consider both the heterogeneous nature of dry traces and donor variation. The identification process entails simply determining which predefined set of spectra (signature) best fits the unknown experimental data. It is important to set criteria for “the best fit.” Our studies successfully tested three statistical criteria: The sum of squares due to error (SSE), the coefficient of determination (R2), and the root mean squared error (RMSE):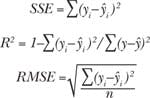
where yi, ŷi,and ȳ indicate actual, fit, and mean values, respectively. Extensive fitting and cross-fitting of the developed signatures supported the validity of this approach.
Body fluid signatures
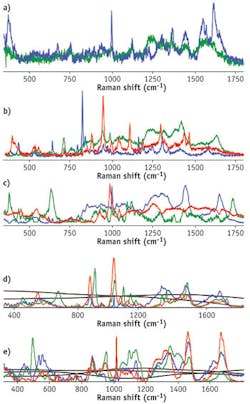
Not only are dry traces of body fluids are heterogeneous in nature, but their chemical composition also varies among donors. For these reasons, no single Raman spectrum can adequately represent a particular body fluid. Our proposed approach is based on the unique multidimensional Raman signatures of fluids.
Usually, the Raman spectra of biological samples have a significant fluorescent contribution. Two strategies based on the concept of spectroscopic signatures can be used to identify unknown stains. The first involves extending the multidimensional signatures with the fluorescent background and a horizontal line—the latter of which takes into account the offset variation.14 In this case, raw experimental spectra can be fitted by components of the signature without treatment. The second strategy involves performing a baseline correction of the raw spectra before the statistical analysis and determination of the multidimensional signatures, which contain only Raman components.18
Both strategies have advantages. Prior baseline correction leaves only a highly informative Raman signal, whereas the incorporation of the less informative but still characteristic fluorescent backgrounds may increase the specificity of the multidimensional signature. Spectral components of human blood, semen, and saliva multidimensional signatures present only the Raman contribution, while the contribution of wider fluorescent features is excluded by prior baseline correction. Full multidimensional signatures of blood, saliva, and semen include averaged fluorescent backgrounds in addition to the Raman spectral components, whereas both Raman and fluorescent components were calculated chemometrically to obtain the multidimensional signatures of sweat and vaginal fluid. We found that these body fluids have varying fluorescent backgrounds and should be represented as a linear combination of several spectral profiles (two profiles for sweat and three for vaginal fluid). The fact that all body fluids have different fluorescent components allows us to speculate that fluorescence should not be viewed as undesirable because it can be used as a significant tool in the process of characterizing particular body fluids. The use of fluorescent components was tested with multidimensional signatures of sweat and vaginal fluid.
All calculated Raman signatures were successfully fitted to experimental data collected from multiple donors of different races, genders, and ages. The high goodness-of-fit of the statistical results demonstrates the high specificity of the developed signatures (see table).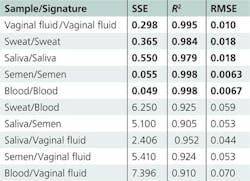
Spectroscopic signatures of nonhuman body fluids have not yet been developed, but preliminary studies have demonstrated that their Raman spectra have characteristic features that allow them to be distinguished from human samples—despite the fact that fluids with similar compositions present a significant problem during species identification. For instance, human, canine, and feline blood traces were discriminated within a confidence interval of 99% by Raman spectroscopy analysis coupled with cross-validated PCA.11
Experiments, results, and conclusions
We tested Raman spectroscopic signatures in multiple samples from a variety of pure body fluids obtained from donors of different races, genders, and ages, and fitted these signatures to the experimental Raman spectra of various dried body fluid stains. We realized high goodness-of-fit statistical results (SSE, R2, and RMSE) for consistent body fluid—Raman signature pairs. Furthermore, we demonstrated that the use of characteristic spectroscopic signatures could be applied to any human body fluid sample for its potential identification and in distinguishing it from other body fluids and substances found at a crime scene. Spectral features of the Raman spectral component were assigned to individual biochemical constituents (see figure at top of this page).
The origin of fluorescent components must still be interpreted with caution because several constituents of human body fluids may have similar fluorescent profiles. The identification of pure body fluids can also be achieved by such chemometric methods as PCA, linear discriminant analysis (LDA), soft independent modeling of class analogy (SIMCA), support vector machines (SVM), and artificial neural networks (ANN). For example, we demonstrated that human, feline, and canine blood samples can be distinguished using PCA. We also tested, LDA, SIMCA, and partial least squares discriminant analysis (PLS-DA) as alternative methods for the discrimination of semen, blood, and saliva traces.16
The application of multivariate classification methods will be significantly impaired in cases of contamination, body fluid mixing, aging, and spectral contributions from substrates. We believe that the effective identification of real-life samples can be achieved using the combination of multidimensional signature fitting with multivariate classification and regression analyses.
Overall, Raman spectroscopy coupled with advanced statistical analysis demonstrates great potential for the nondestructive and rapid confirmatory identification of body fluids at crime scenes. Still, though, more work needs to be conducted before this promising technique can be used by crime scene investigators. Specifically, aging of a biological stain under various environmental conditions, including high and low humidity or photodegradation due to sunlight, should be documented. Our laboratory is expanding this method to include mixtures of body fluids, respectively, and samples contaminated with nonbiological components. Opportunities also exist to utilize Raman spectroscopy for differentiating body fluid traces of human and animal origins at crime scenes.11
Finally, it is worth noting that multidimensional signatures have potential beyond forensic science, to the characterization of any heterogeneous sample. Among the many other possible applications are disease monitoring, differentiation between nonhomogeneous pharmaceutical forms, quality control, studies of developing human tissues, and control of cell culture growth.
ACKNOWLEDGMENTS
We are grateful to Dr. Barry Duceman, Director of Biological Science in the New York State Police Forensic Investigation Center, for continued support, and to Joseph Derubertis for assistance with manuscript preparation. This project was supported by Award No. 2009-DN-BX-K196 awarded by the National Institute of Justice, Office of Justice Programs, U.S. Department of Justice (I.K.L.). The opinions, findings, and conclusions or recommendations expressed in this publication are those of the authors and do not necessarily reflect those of the Department of Justice.
REFERENCES
1. K. Virkler and I. K. Lednev, Forensic Sci. Int., 181, e1 (2008).
2. K. Virkler and I. K. Lednev, Forensic Sci. Int., 188, 1 (2009).
3. E. Smith and G. Dent, Modern Raman Spectroscopy: A Practical Approach, John Wiley and Sons Ltd., Chichester, West Sussex, England (2005).
4. R. Salzer and H. W. Siesler, Eds., Infrared and Raman Spectroscopic Imaging, Wiley-VCH, Weinheim (2009).
5. C. M. Hodges and J. Akhavan, Mol. Spectrosc., 46, 303 (1990).
6. M. J. West and M. J. Went, Drug Testing and Analysis, 3, 9, 532–538, doi: 10.1002/dta.217 (September 2011).
7. A. D. Burnett, H. G. M. Edwards, M. D. Hargreaves, T. Munshi, and K. Page, Drug Testing and Analysis, 3, 9, 539–543, doi: 10.1002/dta.169 (September 2011).
8. J. S. Day, H. G. M Edwards, S. A. Dobrowski, and A. M. Voice, Spectrochim. Acta., 60, 1725 (2004).
9. G. McLaughlin and I. K. Lednev, Anal. Bioanal. Chem. Online, doi: 10.1007/s00216-011-5338-z (2011).
10. E. Widjaja, Analyst, 134, 769 (2009).
11. K. Virkler and I. K. Lednev, Anal. Chem., 81, 7773 (2009).
12. K. Virkler and I. K. Lednev, Forensic Sci. Int., 193, 56 (2009).
13. K. Virkler and I. K. Lednev, Analyst, 135, 512 (2010).
14. K. Virkler and I. K. Lednev, Anal. Bioanal. Chem., 396, 525 (2010).
15. A. Sikirzhytskaya, V. Sikirzhytski, and I. K. Lednev, Forensic Sci. Int., doi:10.1016/ j.forsciint.2011.08.015 (2011).
16. V. Sikirzhytski, K. Virkler, and I. K. Lednev, Sensors, 10, 2869 (2010).
17. S. Boyd, M. F. Bertino, and S. J. Seashols, Forensic Sci. Int., 208, 124 (2011).
18. V. Sikirzhytski, A. Sikirzhytskaya, and I. K. Lednev, “Raman spectroscopic signature of sweat and its potential application to forensic body fluid identification,” paper in preparation.
19. G. Keresztury, Handbook of Vibrational Spectroscopy, 1, 71–87, John Wiley & Sons, Ltd, Chichester, West Sussex, England (2001).
20. J. T. Edsall, J. Am. Chem. Soc., 65, 1767 (1943).
21. A. Bertoluzza et al., J. Raman Spectrosc., 14, 386 (1983).
22. A. Eapen, I. H. Joe, and G. Aruldhas, Spectrosc. Lett., 30, 751 (1997).
23. J. De Gelder, K. De Gussem, P. Vandenabeele, and L. Moens, J. Raman Spectrosc., 38, 1133 (2007).
24. C. D. McGuinness et al., Analyst, 132, 633 (2007).
25. R. Salzer, G. Steiner, H. H. Mantsch, J. Mansfield, and E. N. Lewis, J. Anal. Chem., 366, 712 (2000).
26. P. J. Treado and M. P. Nelson, Handbook of Vibrational Spectroscopy, 2, 1429–1459, John Wiley & Sons, Ltd., Chichester, West Sussex, England (2001).
Vitali Sikirzhytski and Aliaksandra Sikirzhytskaya are research assistants, and Igor K. Lednev is associate professor, in the department of chemistry at the University at Albany, SUNY; lednev.simpot.net/lednev/researchgr.htm; [email protected].