MICROSCOPY/SPECTROSCOPY: AFM-IR: A frontier in nanoscale analysis for biological systems
Michael Lo, Kevin Kjoller, Curtis Marcott, and Roshan Shetty
The technique of infrared (IR) microspectroscopy has been applied for many years, but its use has been restricted by an inability to resolve chemistry on the nanometer-length scale. Conversely, atomic force microscopy (AFM) has excellent spatial resolution in the nanometer range, but has been unable to provide chemical information. The advent of AFM-IR—a combination of both—offers the best of both techniques in a format that can be described as a "lab on the tip." Let's take a look at how this approach applies to the analysis of biological specimens, and how it overcomes the challenges of its individual components.
The popularity of IR microspectroscopy is evidenced by nearly 20,000 journal publications describing applications in pharmaceuticals, life sciences, health and beauty, forensics, and more. Its spatial resolution is diffraction-limited by its long wavelengths: Traditional transmission IR has a practical limit of 10–30 μm, while the more recent attenuated total reflectance (ATR) approach is limited to 3–10 μm.
AFM is a type of scanning probe microscopy; the setup incorporates a cantilever with a sharp tip (probe) at its end that scans the surface of the specimen. While AFM was originally a topographic approach only, the last 30 years have seen the addition of modes able to offer phase imaging, chemical force microscopy, and electrical force measurements. But though the technique is capable of sub-nanometer resolution, it provides very limited chemical information.
Better with both
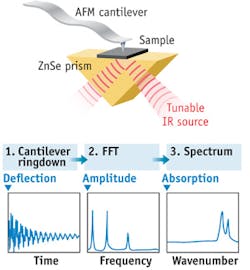
The concept of AFM-IR was first put forward by Alexandre Dazzi and co-workers at the Université Paris-Sud in 2005.1 AFM-IR breaks resolution limits in conventional IR spectroscopy by using an AFM probe to measure IR absorption. The sample is illuminated by a tunable IR source. When a region of the sample absorbs IR radiation, the sample heats up. The heat generates a rapid thermal expansion pulse that can be detected by the AFM cantilever tip. The technique beats the "far-field" optical diffraction limit because the absorbed radiation is measured by the tip in the extreme near-field.
AFM-IR has been developed into a commercial instrument (Anasys Instruments; Santa Barbara, CA). Known as nanoIR, the system uses a pulsed, tunable IR source to excite molecular absorption in a sample that has been mounted on a zinc selenide (ZnSe) prism. The IR beam illuminates the sample by total internal reflection similar to conventional ATR spectroscopy. As the sample absorbs radiation, rapid thermal expansion excites resonant oscillations of the cantilever. The induced oscillations decay in a characteristic ringdown. The ringdown can be analyzed via Fourier techniques to extract the amplitudes and frequencies of the oscillations. Measuring the amplitudes of the cantilever oscillation as a function of the source wavelength creates local absorption spectra; the oscillation frequencies of the ringdown are related to the mechanical stiffness of the sample (see Fig. 1). The IR source can also be tuned to a single wavelength to simultaneously map surface topography, mechanical properties, and IR absorption in selected absorption bands.
Bioanalysis example #1: Stratum corneum
The study of stratum corneum (SC)—the outermost layer of the epidermis—is important in the skin care and beauty industry. A specimen may look nondescript on the surface, but AFM-IR can elucidate chemically distinct structures.
In addition to the amide-I and amide-II bands, which appear because of the presence of proteins, a medium-strong signal at 1732 cm-1 is seen near the center of the specimen depicted in Figure 2 (red curve). This is where the lipids are thought to be concentrated. On the periphery, the specimen would still have lipids, but at a lower level, as suggested by the weaker 1732 cm-1 signals.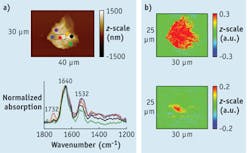
IR imaging using the AFM-IR technique provides further insight into the SC specimen. As expected, the strong amide-I absorption at 1650 cm-1 is observed at nearly every point of measurement within the SC. However, stronger absorptions at 1732 cm-1 are detected mostly in the area identified by the AFM-IR spectra (see Figs. 2 and 3). There is a sharp drop in the intensity of this carbonyl stretching band outside of the 3 × 6 μm red spot in Figure 2. Nevertheless, weaker signals at 1732 cm-1 surrounding this red spot are still seen. This agrees with the results from AFM-IR spectra and also suggests that lipids concentrate into a particular area of this SC specimen.
Bioanalysis example #2: Strephtomyces bacteria
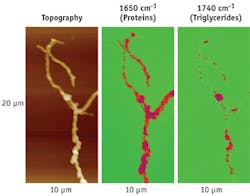
Strephtomyces bacteria are important in soil ecology and for production of antibiotics. AFM-IR can map the position of the energy storage triglyceride vesicles inside these bacteria. An accumulation of white circular features are observable in a transmission electron microscopy (TEM) image of Strephtomyces, and fatty triglycerides are seen readily at 1745 cm-1 in bulk FTIR spectra after incubating these bacteria in culture medium for a few days (see Fig. 4; FTIR is taken after drying the cells). However, this data does not positively identify the chemical makeup of the white features in the cells.![FIGURE 4. Triglyceride vesicles in bacteria are depicted in a TEM image (a; data courtesy of Packter et al., Arch Microbiol., 164, 420–427 [1995]) and in bulk FTIR data (b; data courtesy of Dazzi et al., private communication).](https://img.laserfocusworld.com/files/base/ebm/lfw/image/2015/12/1207bow10f4.png?auto=format,compress&fit=max&q=45?w=250&width=250)
Bioanalysis example #3: Cross-section of hair
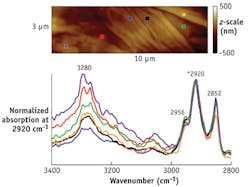
The cuticle is the outermost layer that protects the cortex of the hair. It is believed that parts of the cuticle are slightly more hydrophobic than some other parts of the hair. An indicator of hydrophobicity can be detected in the relative peak intensity changes between 2959 and 2923 cm-1. The former wavenumber pertains to C-H stretches commonly observed in hair proteins, while the latter generally refers to the methylene absorption of lipid.
An AFM image shows the relative band ratio changes depend on the location where the AFM-IR spectrum is taken (see Fig. 6). The results suggest that in this hair sample, one region of the cuticle contains more lipid than the rest of the cuticle.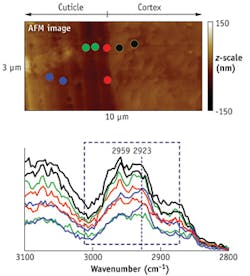
Clearly, AFM-IR combines the best of both AFM and IR microspectroscopy to provide both nanoscale resolution and chemical specificity for bioanalysis, while overcoming limitations of its component approaches. The method is a potentially useful tool for biological research and clinical analysis.
REFERENCE
1. A. Dazzi et al., Infrared Phys. and Technol., 49, 113–121 (2006).
Michael Lo is an applications scientist with Anasys Instruments (Santa Barbara, CA), Kevin Kjoller is vice president with Anasys Instruments, Curtis Marcott is a partner at Light Light Solutions LLC (Athens, GA), and Roshan Shetty is CEO with Anasys Instruments. Contact Lo at [email protected].