FLUORESCENCE IMAGING/MICROSCOPY: Stable light source overcomes FRET problems
Fluorescence resonance energy transfer (FRET) imaging provides an effective way to quantify the interactions of biological molecules, but the approach can be compromised by a number of errors. Stable illumination and precise control can go a long way to overcoming these errors.
By David Noren, Hao Chang, and Andre Levchenko, with Kavita Aswani
Intensity-based fluorescence resonance energy transfer (FRET) measurements, which can be made using either fluorescent dyes or proteins with the appropriate spectral overlap, are a proven means for studying biological signal transduction processes. FRET describes the transfer of energy from an excited fluorescent donor molecule to an acceptor molecule located within the Förster distance (< 10 nm). When energy transfer takes place, it is possible to measure both a decrease in the light intensity emitted from the excited donor molecule and an increase in intensity emitted from the acceptor molecule.
FRET provides an effective way to quantify the interactions of biological molecules using a relative index. Images are taken using the donor excitation wavelength and acceptor emission wavelength (DA), the donor excitation wavelength and donor emission wavelength (DD), and in some cases, the acceptor excitation wavelength and acceptor emission wavelength (AA). The simplest form of the FRET index is calculated using a ratio of the acceptor (DA) to donor emission intensities (DD). However, more complex expressions have been used to correct for spectral "bleed-through."1,2
Intensity-based FRET measurements have been successfully used to study both the kinetic and spatial aspects of signal transduction during live cell imaging. Here, we show HEK cells expressing the FRET probe EKAR (see Fig. 1, row a). Cells stimulated with angiotensin II show an increase in MAPK activity, which is quantified using the FRET index (see Fig. 1, row b). Such measurements do not require equipment and expertise more sophisticated than that normally associated with careful epi-fluorescence imaging. However, like any experimental approach, FRET-based measurements can suffer from experimental errors either inherent to the fluorescent probes or originating from imaging equipment. Some of the most relevant sources of error can be reduced by using a stable and precisely controllable fluorescent light source that provides stable fluorescence illumination.
Problem overcome: Probe signal-to-noise ratio
Over the past two decades, genetically encoded FRET probes have been developed targeting many signaling pathways, including protein kinase C (PKC), phospholipase C (PLC), extracellular signal-regulated kinase (ERK), and Akt.3, 4, 5 These probes can be either a single protein molecule capable of intramolecular FRET, tethering a donor and acceptor fluorophore together via a regulatory domain, or intermolecular, using separate donor and acceptor molecules. With the addition of localization sequences, these probes can be targeted to specific cellular domains.
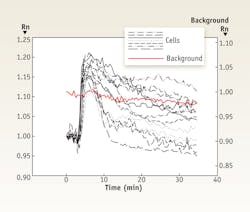
While they have shown great potential in characterizing signaling events, many of these probes suffer from a limited dynamic range and a low signal to noise ratio (SNR). An experiment using the intramolecular FRET probe EKAR, transfected into HEK cells, was imaged using both unstable and stable light sources. In the experiment with the unstable source, cells were stimulated with Angiotensin II and imaged at 30 seconds intervals for 35 minutes (see Fig. 2). Data for panels A and B were taken under the same experimental conditions but sampled at different times during the light source fluctuations. Black lines show the normalized change in the FRET ratio, Rn, for individual cells over time. Variation in the lamp intensity is also formulated using the FRET ratio so that the pattern can be directly compared. The background Rn is given in red and shows up to a 10% fluctuation over time. This background fluctuation superimposes a corresponding pattern on the individual cell measurements. Arrows were inserted into each panel to mark some of the time points where background fluctuation heavily influenced FRET measurements.
By contrast, when data was taken with a source that uses proprietary closed-loop feedback technology to provide short- and long-term intensity stability, the background Rn did not fluctuate more than 2%. More importantly, no artificial patterns were superimposed on the cell data (see Fig. 3).
Photobleaching
An inherent problem with almost all experiments using fluorescent imaging is the irreversible photobleaching of fluorescent molecules.2 This problem can be even more complex in the case of FRET measurements, as the donor and acceptor fluorophore may bleach at different rates.
Although various researchers have devised methodologies (most commonly involving fitting the data to exponential curves) to correct for the effect, it is best to minimize photobleaching as much as possible in the first place.
A light source that offers precise digital control over the intensity output of the fluorescent light allows the researcher to best optimize the intensity and minimize photobleaching. In addition, stability given by an active feedback control ensures that the rate of photobleaching does not change due to changes in the lamp intensity, and allows easier correction of any photobleaching that does occur.
Uneven spatial excitation
Often, it is desirable to study the spatial pattern of molecular interactions during live cell imaging. Uneven spatial excitation can superimpose artificial gradients in FRET measurements, and this is particularly problematic when using bimolecular FRET probes. Perfect alignment of the fluorescent light source overcomes the effect, and yields a homogeneous excitation field. The new technology enables automatic alignment to eliminate cumbersome manual alignment, and ensures uniform field excitation.
Experimental reproducibility
Day-to-day experimental variation is difficult to eliminate with most experimental techniques. A stable source prevents light from being a major contributing factor to this variation. Not only can the intensity output be precisely set, but the output can also be measured and documented using a computer interface. In the case of the X-Cite source, the Optical Power Measurement System (OPMS) can measure output from a light source at the end of a liquid light guide, or at the objective plane, and thus aid repeatability. The OPMS can be also be used to calibrate the source in order to specify the desired current output from the system. While some fluorescent light sources are stable only over a short time period—a fact that limits the number of experimental data points that can be taken in the same day—more sophisticated systems allow continuous data collection without interruption caused by light source fluctuations.
REFERENCES
1. C. Berney and G. Danuser, Biophys J. 84 (6): 3992-4010 (2003)
2. T. Zal and N.R. Gascoigne, Biophys J. 86 (6): 3923-39 (2004)
3. M.T. Kunkel et al., J. Biol. Chem. 18; 280 (7): 5581-7 (2005)
4. J.D. Violin et al., J Cell Biol. 161 (5): 899-909 (2003)
5 C.D. Harvey et al., Proc. Natl. Acad. Sci. 105 (49):19264-9 (2008)
Experimental setup
To demonstrate the difference that a stable light source can make in FRET experiments, we coated 8-well Labtek dishes with 10μg/ml human fibronectin at 4°C overnight. Then, we transfected HEK cells with angiotensin receptor II (angRII) and the EKAR FRET probe using Fugene HD. After 16 hours, we seeded the transfected cells into the Labtek dishes using DMEM supplemented with 10% FBS and p/s. After attachment, cells were serum-starved for four hours.
We conducted the experiments using an Axiovert 200M microscope (Carl Zeiss MicroImaging) with either the X-Cite 120 or the X-Cite exacte light source (Lumen Dynamics Group). Cells were imaged in Leibovitz (L-15) without phenol red, and stimulated with 30 nM angiotensin. The FRET ratio R was calculated as DA/DD as described above, and normalized to the starting ratio at time zero to give Rn.
DAVID NOREN and HAO CHANG are students studying with ANDRE LEVCHENKO, who is Associate Professor in the Signal Transduction and Cell-Cell Communication Lab at The Whitaker Institute for Biomedical Engineering, Johns Hopkins University (www.icm.jhu.edu); KAVITA ASWANI is Senior Product Manager, Life Sciences, with Lumen Dynamics Group Inc. (www.LDGI-XCite.com). Contact Dr. Levchenko at [email protected]; contact Dr. Aswani at [email protected].
More BioOptics World Current Issue Articles
More BioOptics World Archives Issue Articles