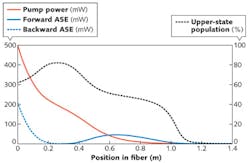
For many applications of optical fibers, it is vital to know various details. Consider an ytterbium (Yb)-doped fiber, into which only a pump wave is injected (see Fig. 1). Even in this simple situation, the fiber behavior is already rather complicated: as a function of varying pump power, amplified spontaneous emission (ASE) and upper-state excitation of the Yb ions vary greatly. Measurements reveal that backward ASE extracts substantial power, but the effect of forward ASE would not be seen as the emission is largely reabsorbed in the fiber before it reaches the end. In effect, pump absorption exhibits surprising variations caused by saturation effects of ASE light.
Only with a numerical model based on reliable fiber data can such details be well understood. The model will then reveal performance-limiting factors and facilitate the planning of prototype tests so that desired results are obtained without too many costly and time-consuming test iterations. To that end, certain essential optical and spectroscopic fiber properties need to be measured. Some straightforward specifications such as outer fiber diameter and coating details are not discussed here, as these are easy to understand and usually have no influence on optical fiber performance.
Propagation losses
If light is to be sent through long lengths of fiber, the propagation losses (in dB/km) are relevant. A simple measurement of output power and incident power is not sufficient because coupling light into the fiber may also cause substantial unknown losses. This problem is often solved with cutback measurements. One first launches light into a longer length of fiber and measures the transmitted power. Then one cuts the fiber back to a substantially shorter length and measures the power again. The difference can be attributed to the propagation losses in the length by which the fiber was shortened. Using a white light source and a spectrometer, one obtains the propagation losses for a range of wavelengths.
Another option is to launch light with a known efficiency, measured in previous tests. Obviously, rather longer fibers make it easier to obtain precise loss data. Time domain reflectometry is another solution, but requires more sophisticated equipment.
For active fibers, the optical power of the probe light must be low enough to avoid significant excitation of the laser-active ions and the resulting saturation effects. Also, the high losses in absorption bands of laser-active ions enforce the use of short fiber lengths; light in cladding modes may then get to the end of the fiber. Particularly if the core absorption is strong and the fiber is stripped, light in cladding modes can spoil the results. One then needs to take special precautions to attenuate light in cladding modes, for example, placing a drop of index-matching fluid on the fiber to let light escape on the side.
Singlemode cutoff
A singlemode fiber supports only one guided propagation mode per polarization direction. Below a certain cutoff wavelength, additional higher-order modes are supported. The simplest method for measuring the cutoff wavelength is to measure the intensity spectrum of transmitted light when a white light source is used as the input. Below the cutoff, the transmitted powers are higher because more modes capture more light.
With a tunable laser source, the cutoff can be seen more precisely. In the singlemode regime, the spatial profile of the transmitted light is very smooth. Below the cutoff wavelength, it becomes asymmetric and strongly wavelength-dependent due to interference effects between the modes.
Mode size, core size, and fiber NA
For singlemode optical fiber applications, the size of the guided mode is normally more relevant than the core size; the latter is not clearly defined for smooth profiles. The guided mode is too small for a direct accurate measurement, but one can simply measure the beam divergence of light exiting the fiber (see Fig. 2). One can usually assume an approximate Gaussian beam for which the divergence half-angle is defined as λ/(πw0), where λ is the wavelength in the medium and w0 is the beam radius at the beam waist. For example, for a mode radius of 5 μm at 1550 nm, the divergence half-angle is approximately 0.1 rad or 5.7°. At a distance of 5 cm, the mode will already have expanded to a radius of 5 mm.The numerical aperture (NA) is not very relevant for a singlemode fiber. It is even useless if the user does not know how it is defined for a fiber with a smooth index profile.
Multimode fibers
Multimode fibers are more difficult to characterize, partly because the input light always excites some mixture of modes, with the power distribution depending on the launch conditions.
For step-index fibers with large cores, the core size and the NA are normally well known from production. The NA is most easily obtained from the refractive indices of core and cladding as measured on the preform. From the core radius and NA, one can calculate the relevant mode properties such as the number of modes and range of group indices.
Graded-index fibers are more challenging. A refractive index profile, possibly measured on the preform and rescaled to the fiber dimensions, can be helpful, as it allows the numerical calculation of mode properties. Propagation losses will generally depend on the mode. Measuring mode-dependent losses is difficult, however.
Chromatic dispersion
For some applications, particularly with singlemode fibers, the chromatic dispersion is of high interest. A relatively direct measurement method is the pulse delay technique, where one measures time delays for ultrashort pulses with different center wavelengths to obtain the differences in group delay. A similar method is the phase shift technique, where one measures the time delay of an intensity modulation. Usually, however, such measurements are limited to narrow wavelength regions.
Most convenient for chromatic dispersion measurements in wide wavelength regions is white-light interferometry. The fiber under test (a singlemode fiber) is incorporated in one arm of a Michelson interferometer with a white light source. The output power is recorded with a simple photodetector while the arm length difference is scanned. An additional interferometer precisely monitors the length changes. With a Fourier transform, one can extract the chromatic dispersion in the full wavelength range of the light source. The spectral resolution is limited by measurement noise, and is thus higher if a high-intensity light source such as a superluminescent diode is used. A modified method (spectral interferometry) uses a spectrometer instead of a simple detector, making the scanning of an arm length unnecessary.
Transition cross-sections
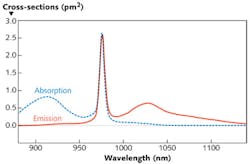
The pump absorption in a rare-earth-doped fiber depends on the doping profile, the mode size, and the wavelength-dependent absorption cross-sections. For a fiber laser or amplifier, the total absorption in dB/m is not the only relevant parameter, as saturation effects cannot be calculated from absorption alone. One also requires absorption cross-sections and the core overlap factor, or at least the product of both; that product determines how strongly the optical field interacts with the laser-active ions. As an example, absorption and emission cross-sections are shown for Yb3+ ions in germanosilicate glass (see Fig. 3).1Often, the absorption is measured easily, and the overlap can be estimated, but the dopant concentration is not known. Its measurement in the small core of a fiber is hard; it is more realistic to do that on a preform. Another possibility is to fabricate a homogeneously doped sample, make a chemical analysis of it to learn the doping concentration, and obtain the absorption cross-sections of the laser-active ions from the measured absorption. One may then assume that the cross-sections are essentially the same for the fibers in order to calculate the effective doping concentration from a fiber's transmission spectrum.
For some more complicated laser-active ions, multiple metastable levels can be relevant, and the cross-sections for excited-state absorption need to be known. These are more difficult to measure than ground-state absorption cross-sections, since the ions need to be excited into some higher level and the fraction of the ions in that level is not usually known. Fortunately, there are modulation techniques that can solve this measurement problem.
Measurement of the fluorescence spectrum taken from the side of the fiber can give the shape of the emission cross-section's curve (taking into account a factor of λ-5 for the translation from emission cross-section to fluorescence intensity in microwatts per nanometer). The absolute scaling may be obtained using the reciprocity principle, for example.
Upper-state lifetime
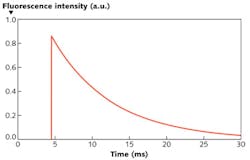
Another relevant quantity is the lifetime of the excitation of the upper-laser level (and sometimes further metastable levels). For long-lived states, it can be sufficient to monitor the fluorescence of the laser-active ions with a detector on the side of the fiber, while a continuous-wave pump laser beam is modulated with a rapidly rotating chopper wheel. The use of a pulsed pump laser is better for short-lived levels (see Fig. 4). Note that the fluorescence decay is not necessarily exponential: initially, it may be faster if upconversion processes via ion-ion interactions take place. One will then obtain shorter lifetimes when measuring with stronger excitation and when using only the high-intensity part of the decay curves.It is generally advisable to compare the measured lifetime with the radiative lifetime as computed from the emission cross-sections. A shorter measured lifetime may result from parasitic decay processes, whereas a longer measured lifetime indicates inconsistency of the results.
Double-clad fibers
Additional complications arise for double-clad fibers, where the pump light is injected into an inner cladding and has an accordingly reduced overlap with the doped fiber core. The resulting pump absorption is reduced due to the limited overlap and is strongly mode-dependent.
Therefore, it is actually not well characterized by a simple wavelength-dependent absorption coefficient, except if strong mode mixing is obtained as a result of a suitable fiber design such as one with a D-shaped or octagonal inner cladding. With strong bending of the fiber, mode mixing and thus pump absorption may be enhanced.
Better characterization needed
Unfortunately, many commercial optical fibers do not come with proper specifications for essential details, particularly concerning spectroscopic data. The required know-how is not trivial and is not always available in-house. It is common to specify only the fiber's absorption at one or two wavelengths such as a common pump and signal wavelength, whereas cross-section data are often not presented. Some manufacturers can at least offer data for their most popular fibers.
For commonly used Yb-doped fibers, the chemical core compositions vary little from the data shown previously in Fig. 3. Some absorption figures then serve to determine the doping concentration. This may already be sufficient for quite accurate modeling results. The situation is more difficult for erbium (Er)-doped fibers because they have more variable chemical compositions. Note also that fiber data can vary substantially between different fabrication runs if the fabrication conditions are not stable. The device performance may then also be inconsistent.
It is often remarkable how limited the available data are for optical fiber. For example, one can hardly imagine a manufacturer of electronic chips who leaves it to his/her customers to find out exactly how these chips behave in common active or passive applications. Specialty fiber technology is a field where relatively small quantities are sold, and manufacturers often hesitate to invest heavily in fiber characterization. It would be more efficient, though, if the manufacturers rather than the users would measure these data in order to facilitate the development of fiber devices.
REFERENCE
1. R. Paschotta et al., IEEE J. Quantum Electron., 33, 7, 1049 (1997).


