Spectrum analyzers characterize tunable sources
Bita Nosratieh
Automated test setup minimizes time required for spectral characterization of tunable lasers in a production environment.
In a dense wavelength-division-multiplexing (DWDM) system the desire to tighten the channel spacing continues because it is one approach to increase bandwidth. High-capacity performance must be cost effective, however. To drive the cost down, new components that are optimized for cost and utilization are introduced to the marketplace rapidly. Tunable laser-source (TLS) modules are among these components. In a typical DWDM system, the lasers must operate at specified wavelengths, which need to be precisely locked into the International Telecommunication Union (ITU) grid. As the number of channels increases within a fixed span, these laser signals must be kept from interfering with each other. Hence, designers must ensure that the laser diodes produce the right amount of a useful signal with the proper characteristics.

Most current systems are based on distributed-feedback lasers (DFBs), which are locked into specific wavelengths and cannot be used in other grid wavelengths. Tunable sources eliminate the need for having spare lasers for each unique wavelength. They provide flexibility and efficiency in DWDM systems. Depending on their design and cost they can tune up to 80 channels. Typically, lasers that tune over a smaller range have higher output power.
There are many reasons for using TLS modules in DWDM systems. One of the more obvious, noted above, is to reduce inventory. Another emerging application area is optical switching. Fast wavelength tuning makes tunable lasers candidates for wavelength switching, and higher switching speed makes them candidates for routing traffic on a packet-by-packet basis. There are several types of tunable laser modules that each use different technologies. These include tunable gain-control DFB lasers, distributed Bragg reflectors (DBRs), tunable electro-modulated lasers, sampled grating DBR devices, superstructure grating DBRs, and vertical-cavity surface-emitting lasers (see Laser Focus World August 2001, p. 101).
Each of these types of TLS modules offers different advantages. The trade-off is typically between tuning range, power output, and switching speed. Output wavelength can tune from 10 to 40 nm. Output power can range from 1 to 10 mW, and the switching speed can vary from <10 ns up to 1 ms.
Key parameters
These devices must be well-characterized and designers must know various fundamental parameters, including power output, operating wavelength, linewidth, relative intensity noise (RIN), and side-mode suppression ratio (SMSR). Such measurements are not new, they are similar to those performed routinely on standard DFB lasers. But since TLS modules tune across many wavelengths, minimizing the time taken to test them becomes a major challenge. Every laser off the production line is different. Each must be tested to determine which combination of current and temperature will deliver the required wavelengths. The total number of tests can exceed one thousand per laser because of the wide wavelength range. So manual testing can take "days per laser," instead of the required "minutes per laser." Hence the need to improve test time using automation, new test methods, and faster instruments.
Power and wavelength
The power output from a tunable laser is determined primarily by the power in the main spectral peak of the device. The peak amplitude can range from 1 to 10 mW or more. A power meter provides power in units of dBm that can be converted to milliwatts using the equation:
dBmopt=10 log (Popt/1 mW)
As mentioned, the peak wavelength of the device's primary spectral component also must be measured. Because DWDM systems pack wavelengths close together, this value must be known to within a few picometers to ensure adjacent DWDM channels don't overlap. In a DWDM system the center wavelength must be locked to within 5% of channel spacing5-GHz lock for a 100-GHz spacing, for example. To meet such system specifications, the wavelength accuracy required from a multiwavelength meter is in the range of 0.3 to 0.5 GHz (about 2 to 4 pm).
In an ideal laser, the main spectral peak would contain all the power produced by the device. But in reality, the laser signal contains side peaks, also called side modes, which contain some power. The side-mode suppression ratio (SMSR) of a TLS module describes the amplitude difference between the main mode and the largest side mode in decibels. A typical value is around 40 dB at 30 GHz and 1000 GHz away from the main mode, indicating most of the power exists in the main mode. Higher performance lasers have higher SMSR values. An optical spectrum analyzer (OSA) is ideal for this measurement because it can provide amplitude vs. wavelength information, and it has the required dynamic range to perform such measurement. Since speed of measurement is important, the OSA sweep time should contribute as little to test time as possible.

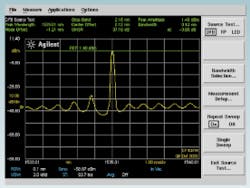
The low-power spectral components of a laser also figure into TLS characterization, so their location in the frequency domain must be known. The information from the OSA allows determination of the mode offset, which is the wavelength separation (typically 1 nm) between the main mode (the highest peak) and the largest side mode. The stop-band, which is the wavelength spacing (about 2.2 nm) between the two side modes adjacent to the main mode, also can be measured (see Fig. 1). Then, the center offset of the laser can be calculatedthis indicates how well the main mode is centered in the stop band. The center offset equals the wavelength of the main mode minus the mean stop-band wavelength. The smaller the offset, the better the laser performance.
System designers need this wavelength information to establish the positions of the side modes relative to the peak output from the laser. If the side modes are present too far from the peak output they can interfere with nearby laser signals. In fact, a laser has a much narrower peak: about 10 MHz, or 0.00008 nm. The spectral peaks displayed by an OSA arise from the limited resolution of the instrument's bandwidth filter. To more accurately measure laser bandwidth, often called linewidth, optical heterodyne spectrum analysis can be used.
Test setup
Once the performance requirements of the test equipment are established, the need to conduct this measurement as fast as possible must be met. The best approach is to have the required instruments in an automated remote measurement configuration controlled by an external PC (see Fig. 2). Multiwavelength meters generally have the fastest measurement speed so they can be used to located the laser's peak wavelength first and the OSA can set up span and appropriate resolution bandwidth to perform the SMSR followed by quick power measurement using the power meter. To optimize test time further, and reduce OSA measurement time, it is best to eliminate the time consumed to process and display graphics and data on the screen because all measurements are done automatically (no manual use of the instrument involved). This way the data can be transferred directly via GPIB (General Purpose Interface Bus). This feature of OSAs, when available, can save as much as 40% of test time.
BITA NOSRATIEH is product marketing manager at Agilent Technologies' Lightwave Division, 3910 Brickway Blvd., Santa Rosa, CA. 95403; e-mail: [email protected].