Nanometrology: Controlling error sources yields nano-accurate interferometry
HAN HAITJEMA
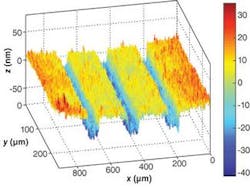
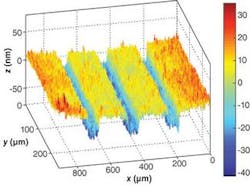
Nanometrology involves measurement of dimensional features in one, two, or three dimensions with uncertainties that can be expressed in nanometers (see Fig. 1). Both surface and displacement interferometry have evolved to a point that measurements with nanometer uncertainties are possible, because the major error sources are well understood and can be well estimated (see “Achieving nano accuracy in surface measurements,” p. 88).
Capacitive and inductive sensors can also achieve subnanometer resolution over a small range, and linear scales rival interferometric techniques at longer ranges. But when it comes to uncertainty and traceability, capacitive and inductive sensors need to be interferometrically calibrated.
Displacement interferometry
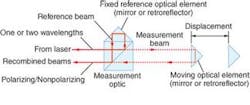
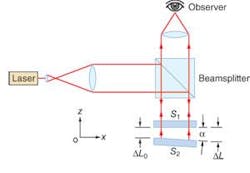
Displacement interferometry is based on the light-dark transitions corresponding to constructive and destructive interference (see Fig. 2). Homodyne interferometers work with only one frequency, while heterodyne interferometers work with two frequencies. Both types ultimately measure a displacement d, which is counted as a number N of half wavelengths λ plus a fraction that is usually called the phase change ∆φ. The displacement d is given by:
The equation indicates the major error sources: the wavelength, the count number, and the phase difference. In modern systems, the resolution generally falls between 10 and 0.1 nm.
Two potential sources of error in displacement interferometry are related to alignment. The first-order alignment error, Abbe error, appears when the measurement axis and the axis along which the displacement must be known are not in line. For small rotational errors of the moving member, the error is equal to the rotational error times the distance between the axes, also called the “Abbe arm.”
The second-order alignment error is called cosine error, because its magnitude is proportional to the cosine of the angle between the intended alignment and the actual alignment. For the typical small angles this works as a second-order effect as the cosine approaches unity with the square of the angle. On one hand this means that good alignment can keep the effect negligible, on the other hand the effect is hard to correct once it occurs. An alignment error of 1 mm/m, for example, gives a relative deviation of 5 × 10⁻⁷ in the measured displacement.
Additional displacement error sources
Wavelength can present another source of error in displacement interferometry. The wavelength λ depends on the frequency f and the refractive index of air n and is given by
where c is the speed of light. The refractive index of air depends on the air pressure, temperature, humidity, and CO2 content. Once these data are known, there are standard equations for calculating the refractive index with an uncertainty on the order of 10-8.1 The deviation in each of the environmental parameters that correspond to a measurement deviation of 1 × 10⁻⁶ in length are 4 hPa for pressure, 1.1°C for air temperature, 100% for humidity, and 0.6% CO2 for content.
The latter two values are unrealistic, however, because these factors only become important for uncertainties far below 1 × 10⁻⁶. The frequency f is usually obtained from a stabilized He-Ne laser source with a stability of less than 1 × 10⁻⁸. And because the commonly used stabilization techniques are well developed, they seldom present problems. If the source is a laser diode this can be a point of concern, however.
Periodic errors in displacement interferometry are also called nonlinearities. These are errors in determining the fraction of a wavelength or the phase ∆φ. Usually this phase is determined by taking in-phase and out-of-phase measurements of signals measured in phase-quadrature. In heterodyne interferometry this comes down to electronic phase measurements. In homodyne interferometry, the intensity is measured when the phase is shifted 90°. Errors occur when the contrast of the interferometer signal is not perfect and also when the phase-shifted signal is not shifted by exactly 90°.
In general, homodyne interferometers are somewhat more sensitive to this effect, but correction is somewhat easier for homodyne interferometers. The general error model and compensation method that are commonly used were given by Heydemann.2 Other error sources that give this kind of periodic deviation are imperfect polarization beamsplitters and retarders, as well as imperfectly polarized incoming beams in the case of heterodyne interferometry.3 Unless carefully performed, these sources can give deviations of up to tens of nanometers for homodyne and a few nanometers for heterodyne systems.
Dead path error in displacement interferometry is similar to wavelength error, but it refers to the path length through the air that is not used in the measurement. If atmospheric conditions change during the displacement measurement, the changes will affect the full path through air of the beam.
Surface interferometry
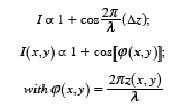
Surface interferometry-which can be carried out in classical Michelson and Fizeau setups-can be considered as a kind of displacement interferometry. Key differences are that an array of photodetectors (like a CCD camera) is used, and the (static) phase difference among several areas on the surface is taken to represent the surface features (see Fig. 3). In this case, the equation on p. 87 is valid for the distance between the reference surface and the surface to be measured as shown in Fig. 2. For an optimum contrast, the intensity is proportional to:
Several methods can be used to determine the surface structure z(x,y). One method is essentially similar to homodyne interferometry, except that CCD cameras are used instead of photodetectors. This method is called instantaneous phase shifting because it takes a very short measuring time and there is no time difference between images taken with a different phase shift.4
More commonly used is temporal phase shifting. The reference mirror is displaced over a half wavelength in five (or more) steps, and the phase per pixel is derived from the various intensities.5 In these cases the interference number N remains undetermined and unimportant. When the phase passes 360°, however, it should continue instead of starting at zero again. The process of removing these discontinuities, a separate subject, is referred to as phase unwrapping.
A third way to determine the surface heights is to consider the whole interference pattern. The reference plane is tilted to guarantee a constant number of fringes, which results in fringes with a determined spatial frequency or carrier frequency. Surface deviations give deviations in this spatial frequency that can be converted to height differences by a Fourier transform and additional manipulations. This method is referred to as the carrier-fringe method, and compared to the other methods it has relatively limited lateral resolution. 6
Error sources in surface interferometry
The basic error source in surface interferometry is the reference surface. All measurements refer to this surface. Methods exist to make or to approximate an absolute flatness calibration, but are limited by various error sources.7
Because the range of distances is small, wavelength and atmospheric conditions exert little effect on the measurement result in terms of the height between highest and lowest point on the surface. And a relative uncertainty of 10-6 is well within a nanometer. In this case the dead path error, as described for displacement interferometry, becomes dominant. Perturbations in the air between the reference surface and the surface to be measured cause these deviations over the whole length of the gap. In the phase-stepping method, this can be reflected in poor contrast and problems with phase unwrapping. In the other two methods this perturbation is frozen in the calculated surface, where the user does not notice it.
Periodic errors can appear in surface interferometry from sources that include nonlinearity in detectors, incorrect and unequal steps in the phase-shifting methods, and atmospheric perturbations during the phase steps. In the carrier-fringe methods, all problems with the Fourier transform, such as signal leaking and aliasing will give mainly periodic errors.
Errors in microscopic interferometry
Microscopic interferometry has error sources essentially similar to those for displacement and surface interferometry. In monochromatic interferometry, the effective wavelength must be carefully observed, as beams are strongly convergent. The correction for this effect is called aperture correction and depends on the numerical aperture of the microscope objective. In white-light interferometry, the light no longer has a defined wavelength, but is used for zero detection. The height information comes from an independent length scale in the system, and therefore introduces the errors contained in that system (Abbe errors, for instance).❏
REFERENCES
1. K.P. Birch, M.J. Downs, Metrologia30, 155 (1993).
2. P.L.M. Heydemann, Applied Optics20, 3382 (1981).
3. S.J.A.G. Cosijns, H. Haitjema, P.H.J. Schellekens, Precision Engineering26, 448 (2002).
4. B.K.A. Ngoi, K. Venkatakrishnan, N.R. Sivakumar, T. Bo, Optics Communications190, 109 (2001).
5. L.Z. Cai, Q. Liu, M.Z. He, X.F. Meng, Optics Communications249, 95 (2005).
6. S. De Nicola, P. Ferraro, Optics Communications, 151, 217 (1998).
7. J. Grzanna, G. Schulz, Optics Communications77, 107 (1990).
HAN HAITJEMA is director of the Mitutoyo Research Center Europe, De Rijn 18, 5684 PJ Best, The Netherlands; e-mail: [email protected]; www.mitutoyo.co.jp/global.html.
Achieving nano accuracy in surface measurements
In surface interferometry, one speaks usually of errors in terms of fraction of a wavelength, such as λ/20. For λ, usually red laser light is used, so λ is approximately 633 nm. The quality of reference surfaces is usually λ/20 or better. Periodic deviations can be on the order of 10 nm. However, these deviations are easily recognized when after measurement the surface appears to have a structure that corresponds to the original interference pattern. With lots of care and averaging, measurements with nanometer uncertainties can be obtained.
Microscopic surface profilers can easily resolve subnanometer features on surfaces, but determining their magnitude and uncertainty is rather complicated. If the surface is not reasonably smooth, but has high gradients, tilted surface areas can direct the beam outside of the system, causing large measurement deviations. In microscopic interferometry this is a major source of differences in surface measurements based on mechanical probes or taken with atomic-force microscopes.
