ADVANCED APPLICATIONS: REMOTE SENSING: The Earth gets a checkup
The state of the world's atmosphere, the growth of its forests, the health of its oceans, and even the locations of its minerals are all monitored, sometimes routinely, from satellites and airplanes using laser-based remote sensing. While the basic techniques of remote laser spectroscopy, lidar (light detection and ranging) and DIAL (differential-absorption lidar) are now fairly mature, advances in equipment sensitivity continue to enlarge their application base.
The basic principle underlying all laser remote sensing involves illuminating a distant target with a range of laser wavelengths and then detecting a return signal produced by either direct absorption, fluorescence, or Raman scattering. Absorption techniques are the most straightforward and widely applied. In the atmosphere, for example, long-path absorption spectroscopy is used in two wavelength bands—the infrared (IR), where many molecules have characteristic fingerprints, and the ultraviolet (UV) to visible range. To minimize the strong absorption of water vapor and CO2, which can reduce the range of lasers, the main IR bands used are below 2.5 µm, 3-5 µm, and 8-14 µm.
In a typical case, the laser is alternatively tuned to a wavelength within the absorption band of interest and then to a wavelength with negligible absorption, so that the difference in the signal returned either from a surface or from air- or water-borne particles is recorded. This differential measurement allows the elimination of unknown parameters such as the density of scattering aerosols. Such applications require tunable lasers, either tunable diode lasers in the IR or Nd:YAG dye lasers in the UV to visible range. All-solid-state systems also are becoming more common.
Options
For lidar to achieve three-dimensional mapping in the air or water, a pulsed laser scans across the volume to be surveyed. The return time of the reflected or scattered pulses provides range information, as in radar. For typical pollutants, such as sulfur dioxide, nitrous oxide, ozone, and mercury, detection ranges for the part-per-billion detection level are between 0.5 and 5 km.
By alternating "on" pulses in absorbent bands with "off" pulses at other wavelengths, lidar also provides differential measurement and is then routinely called DIAL. This allows real-time measurement of concentration levels, which is useful for monitoring industrial emissions.
The main alternative to direct-absorption spectroscopy is Raman scattering. This occurs when photons are inelastically scattered from molecules, exciting them in the process and releasing some photon energy. Thus, Raman return signals are at a different, longer wavelength than the exciting wavelength. Still, Raman cross sections are much smaller than absorption cross sections, so the Raman technique works well only for higher concentrations (hundreds of parts per million) and distances of less than 1 km.
The other major technique, fluorescence spectroscopy, has limited use in atmospheric measurement because the return signal is too weak. The technique is, however, an excellent way to monitor solid targets in the biosphere, such as oil spills, algae bloom patches, and forest area. The fluorescent signal from plants originates in the excitation of chlorophyll and other leaf pigments. Not only is the strength of the fluorescence signal indicative of plant activity, the rate of decay of the fluorescence is indicative of stress. For example, a five-day water shortage will cut the decay time from 1 to 0.45 ns.
Detecting decay times is not simple when observing a forest, however, because interference effects related to individual leaves will smear out the fluorescence signal. In this case, a simple reflectance signal can give information on the distribution of the height of leaves. These data can then be subtracted from the florescence signal to obtain a fluorescence decay time.
Mapping minerals
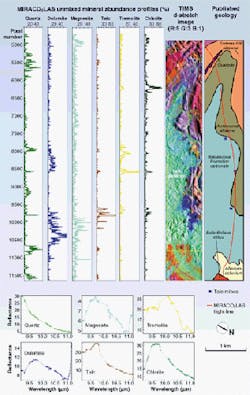
A geological mapping example of laser remote sensing is the MIRACO2LAS (mid-infrared airborne CO2 laser system) project in Australia.1 The project uses a 100-channel rapidly tuned airborne laser to survey mineral types. The laser system, operating at wavelengths between 9.2 and 11.2 µm, combines 100 different 10-µs pulses into 1.6-ms bursts. The bursts, scanning through the entire band, repeat every 25 ms, corresponding to 2 m of forward travel for the aircraft. When the aircraft flies a distance of roughly 400 m, the system produces a line profile, with the complete reflectance spectrum available with 2-m resolution. The return signal is picked up with a 30-cm-aperture Cassegrain telescope. The signal-processing system separates out the pulses according to their time of arrival and converts them to a digital spectrum.
The short pulse length ensures that the laser signal has a high intensity, so background reflectance from the surface is relatively insignificant. By matching the detected spectra with spectra obtained in the laboratory from samples of various minerals, the MIRACO2LAS team has produced detailed geological maps over wide areas of Australia (see Fig. 1). This work is funded by CSIRO of Australia and ERSDAC and Sumitomo Metal Mining Limited of Japan.
Measuring the wind
In addition to monitoring pollutants, lidar is widely used to measure wind velocities via Doppler shifts. Such devices can supplement radar for tasks such as wind surveillance at airports. Recently, improved laser stability has expanded lidar to more ambitious projects, including the study of winds in the stratosphere. Such a facility was set up at the ALAMOR research station at Andoya (Norway) with the goal of studying stratospheric motion in the Arctic, where the jet stream and other wind systems have major impact on climate throughout the world.2
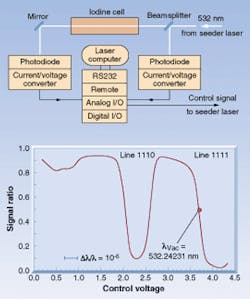
ALAMOR's system, devised by Jens Fiedler and colleagues of the Institut für Atmospharenphysik an de Universität Rostock, (Kuhlungborn, Germany), relies on a frequency-stable laser source to detect small Doppler shifts in the backscattered signal—frequency shifts on the order of a few megahertz or one part in a hundred million. In addition, the two lasers used to measure wind velocities in two perpendicular directions must be wavelength-matched to the same accuracy.
The ALAMOR system achieves this by setting up a seeder laser to drive both main Nd:YAG lasers. The seeder, in turn, is locked to an iodine-absorption line by creating a feedback loop linking the output voltage to the laser, which controls the frequency, which is then linked to a photodetector measuring absorption from an iodine cell (see Fig. 2). By centering the laser-output frequency on the sharp slope of an iodine-absorption line, the researchers can maintain almost a 1% change in photodetector output for a 4-MHz shift in frequency. This produces the required stability for the application.The lidar system also requires a narrow 100-µrad beam to sufficiently concentrate the signal to overcome the background daylight because capability to monitor winds during the daytime and at night is crucial to the project. Currently the ALAMOR system runs fully automatically for up to 100 days at a time.
Enhanced sensitivity
Despite recent progress in lidar applications, there are still limits on its sensitivity and accuracy in monitoring pollutants in the atmosphere. One concern is that the returned signal is often a complex product of absorption by aerosols and a combination of absorbing molecules, which are difficult to sort out merely by subtracting the signal at one wavelength from that at another.
Studies at the Massachusetts Institute of Technology (Cambridge, MA) indicate that frequency-modulation spectroscopy might substantially increase sensitivities.3 With this technique, an electro-optical modulator imposes a frequency modulation on the laser output, and the detector is then tuned to this frequency-modulation signal. As the laser is continuously scanned across an absorption line of interest, the signal is reinforced, appearing at the same phase in each cycle. Contributions to noise, such as laser amplitude variations, don't show up at the same frequency as the modulation and are rapidly averaged out. While frequency-modulation lidar techniques are still in the development phase, it seems likely that, once commercialized, they will further expand the application realm of remote laser sensing.
REFERENCES
- T. J. Cudahy et al., IEEE Trans. Geoscience and Remote Sensing 37, 2019 (July 1999).
- J. Fiedler et al., IEEE Trans. Geoscience and Remote Sensing 37, 748 (March 1999).
- I. Dubinsky et al., Appl. Phys. B 67, 481 (Sept. 1998).
About the Author
Eric J. Lerner
Contributing Editor, Laser Focus World
Eric J. Lerner is a contributing editor for Laser Focus World.

