Hyperspectral Imaging: Hyperspectral endoscopy links retinal changes to Alzheimer’s disease progression

Work begun in 2015 by researchers at the Center for Drug Design (CDD) in the College of Pharmacy at the University of Minnesota (UMN; Minneapolis, MN) that focused on the use of hyperspectral imaging to monitor beta-amyloid aggregates (specifically, soluble amyloid aggregation events) in the retina of mice with Alzheimer’s disease (AD) has since progressed to human clinical trials that are anticipated to continue through 2019.1
Hyperspectral images of various locations on the retina of Alzheimer’s mice enable monitoring of wavelength-specific spectral and spatial reflection data that indicate the presence of low-order soluble amyloid aggregates. Unfortunately, currently used clinical methods for AD diagnosis depend on detection of amyloid plaques in the brains of AD patients through invasive methods or upon autopsy when it is too late for patient intervention. And while there is yet no clinical proof that AD is caused by these plaques (see https://goo.gl/VKtxf1), more-recent literature has focused on the identification and validation of soluble amyloid aggregates as clinical biomarkers, as they show correlation with cognitive decline and are present in all AD patients.
The early-detection method presented here could, along with other noninvasive related methods now in development like optical coherence tomography (OCT), significantly advance AD research, treatment, and hopefully prevention.
Hyperspectral data setup and analysis
To gather retinal data from the AD mouse model, a 5 cm graded-index (GRIN) lens otoscope with a 3-mm-diameter tip gathers the diffuse fundus signal reflected from the eye, which is illuminated through the sides of the endoscope (with the hyperspectral signal) and from the tip (for viewing light only) via a crescent-shaped fiber-optic illuminator. The hyperspectral light source is a dual-slit scanning monochromator with 15 nm bandwidth tunable between 400 and 800 nm. The GRIN lens center and illumination path are separated by 1.3 mm, enabling different angles for view light and input spectral light.
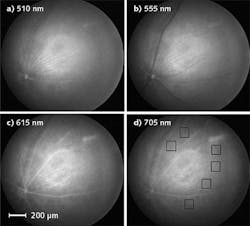
Retinal images at 16 wavelengths from 480 to 705 nm and separated by 15 nm (taking a total of 20 seconds) were transmitted using a fluid light cable and recorded by a camera (see figure). The entire endoscope setup was mounted on a translation stage to achieve optimized vertical distance to the eye and also scan to different parts of the retina devoid of major blood vessels and other occlusions. Illumination at the eye was measured to be 10 µW—a safe value assuming a 2.8 mm dilated mouse pupil, according to IEC standard 60825 for permissible exposure levels.
Monochromatic images at various wavelengths accentuate different features within the retina itself (see figure). But to determine the presence of beta-amyloid plaques, optical-density values were determined from equations using reflectance spectra data from nominal 50 × 50 pixel areas in six locations across the retina. The time-resolved reflection data were normalized to unity values at 705 nm, which is outside the range where AD-dependent spectral changes have historically been observed. These optical-density values indicate presence of plaques, and changes in reflectance spectra over time quantify plaque buildup and disease progression.
Clinical trials
With the Alzheimer’s mice data being corroborated by in vitro tissue analysis, human clinical trials were approved and began in late 2016 at UMN. In a presentation at the CTAD conference in late 2017, hyperspectral data on 12 normal individuals (no clinical signs of AD) and 19 AD individuals revealed greater amyloidosis in AD patients that correlated with functional cognitive decline, in effect translating the mice study to human patients.2
“Preliminary results are promising and this technique presents the opportunity to detect early disease in a truly noninvasive manner, with no need for application of exogenous labels before testing,” says Dr. Swati More, CDD assistant professor.
“We plan to conduct additional studies comparing retinal HSI results with the current clinical standards, amyloid PET and MRI,” adds Dr. Robert Vince, CDD lead investigator of the study. “We anticipate that soluble retinal amyloid measurement will be a feasible biomarker for detection of preclinical AD, which could be useful for population screening.”
REFERENCES
1. S. S. More et al., Invest. Ophthalmol. Vis. Sci., 57, 7, 3231–3238 (Jun. 2016).
2. See https://goo.gl/x6p7rv.
About the Author

Gail Overton
Senior Editor (2004-2020)
Gail has more than 30 years of engineering, marketing, product management, and editorial experience in the photonics and optical communications industry. Before joining the staff at Laser Focus World in 2004, she held many product management and product marketing roles in the fiber-optics industry, most notably at Hughes (El Segundo, CA), GTE Labs (Waltham, MA), Corning (Corning, NY), Photon Kinetics (Beaverton, OR), and Newport Corporation (Irvine, CA). During her marketing career, Gail published articles in WDM Solutions and Sensors magazine and traveled internationally to conduct product and sales training. Gail received her BS degree in physics, with an emphasis in optics, from San Diego State University in San Diego, CA in May 1986.