Specifications don't always tell the whole story
When choosing a motion-control product for a particular application, products are commonly chosen based on the specifications supplied by the manufacturer. These specifications, however, are often gathered under ideal conditions and rarely replicate an actual real-life environment. Hence, the specifications may not be an accurate indication of how the device performs outside the test laboratory. Moreover, a wide range of values can be obtained for a given specification in the same test setup, depending on the methodology and mathematics used. So how the equipment specification is obtained—from environmental factors to methodology—is actually as important as the number itself.
To demonstrate that a wide variety of "specifications" can be generated for a single characteristic we compare the measurement of one parameter—repeatability—with one test setup but with the data gathered in a variety of ways. Differences include the number of data points, the "randomness" of those points, different statistical and mathematical methods, and which metrology standard is used.
Data collection
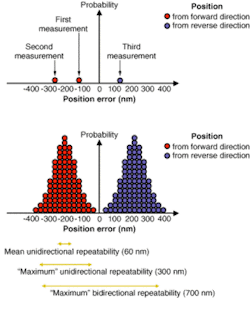
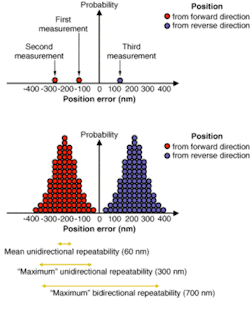
Quantifying repeatability begins with the collection of data. Quality of data has everything to do with the manner in which it is collected because this determines both the probability of error and the margin or size of error. A simplified example of the potential for error based on the direction of movement of a positioner shows that quite different data result—with a large potential for error—based on measurements taken from either the forward or reverse direction of motion (see Fig. 1, top).
FIGURE 1. Measurements of a positioner taken from either the forward or reverse direction of motion highlight the importance of how the measurement is taken. The first measurement shows an error of 110 nm, the second 260 nm, while the third taken from the other direction yields 140 nm (top). Multiple measurements generate a distribution of errors. Here, for example, normal distributions of two different sets of data are shown based on the direction from which the measurements were taken (bottom). There can be many different definitions of repeatability. The three shown here are mean unidirectional, maximum unidirectional, and maximum bidirectional.
But what exactly is the "repeatability" of these measurements? Is it 110, 260, or 140 nm, or something else? Depending on the direction of measurement or data collection, a range of distribution of possible error can be constructed. In fact, the range of repeatability will vary depending on the definition of repeatability used (see Fig. 1, bottom).
Mathematics applied
In quantifying repeatability, certain rules apply: the "mean" value is a statistical formula dependent on the number of samples (that is, error measurements) taken and is given by:
where the mean value, x, of the sample or simply the sample mean is defined as the sum of the samples divided by the size n of the sample.
The "maximum" value is dependent both on the mean and on the number of standard deviations ("sigma" or "σ") of the sample population. Sigma is calculated as follows:
But in order to begin to properly determine the true value of repeatability, additional information is required. This includes the sample size (note that the term "n–1" carries a different "weight" for small and large sample sizes; and if the final value is based on 2σ, 4σ, 6σ, or other (for example, ISO 230-2 assumes 4σ)
So it is important for the potential user to ask questions about the stated specifications based on these criteria. Such questions might include looking at whether a data sheet specifically states uni- or bidirectional repeatability; mean, maximum, or some other formula; 2σ, 4σ, or 6σ; the amount of measured data points; and the percentage of the total travel range used in the data collection? Only after answering these types of questions can specifications be properly compared (for motorized positioners).
Repeatability values applied to motion control
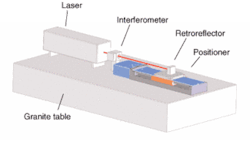
To illustrate how a single, unchanged test setup can still produce a variety of repeatability values, a translation stage was set up as the test bed (see Fig. 2). Data was gathered using two different methods: "linear scan" and "pendulum (see Fig. 3)." With both methods, the stage was allowed to settle to its final position before obtaining values. In all cases a position is approached from a distance that is greater than the combined backlash and hysteresis. The encoder value was then compared with that of the interferometer.
FIGURE 3. In the linear-scan method (left) positional data is acquired by first moving to position 1 (the left-most position) and to each subsequent position left to right. The direction of motion is then reversed to acquire values at each position from right to left. The method is repeated until five values have been acquired for each position and from each direction. (Any number of values can be acquired; five was chosen for this example). For the pendulum method (right) values are obtained by moving back and forth at the first position until five values are acquired from each direction. The latter is repeated for all subsequent positions.
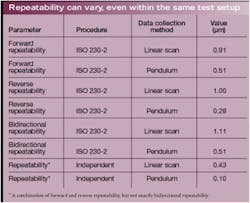
Once the data was gathered, both the ISO 230-2 procedure (Note: ASME B5.57 is essentially the same) and an independent, industry-utilized procedure were used to calculate repeatability. For this specific example, the important differences between ISO 230-2 and the independent procedure are the mathematics used to interpret the data set. Dramatically different repeatability values—ranging from 0.10 to 1.11 µm—can be obtained with the same test setup using different data-collection methods and different analyses (see table).
One reason for the different values obtained with the linear-scan and pendulum methods is the effect of temperature. In the linear-scan method, a longer section of the positioner's screw is subject to heating as the positioner moves over its full travel during data acquisition. Heating from pendulum-type motion is localized, however, and the time to acquire data for any one position is much shorter. Thus, the two methods may give significantly different results for repeatability, and specification sheets alone generally do not provide more information than the final number.
Behind the specification
Repeatability means different things in different applications and environmental conditions. Furthermore, the same analysis methods applied and referenced here can be used for accuracy, pitch, yaw, roll, and many other specifications including vibration control and optics. Specifications for motion-control product performance and repeatability can be essentially meaningless unless grounded in the same foundation as that of the intended application and obtained under similar operating conditions. The equipment user should, therefore, always make a point of asking how the specifications were obtained and evaluated. Environmental factors such as temperature, relative humidity, airborne contamination, background noise, and vibration, must all be accounted for because they all can affect performance of motion-control products.
REED FARRAR is systems test and metrology laboratory manager and BING KONGMEBHOL is product line manager at U.S. Motion Control, and THOMAS BARTHOLOMÄUS is product line manager at Worldwide Motion Control at Newport, Irvine, CA; e-mail: [email protected]


