Scanning interferometer characterizes surfaces
THOM CONNOLLY
The development of scanning white-light interferometry (SWLI) is in many ways a back-to-basics scenario. As interferometry progressed from using white light to monochromatic light to lasers to computerized fringe analysis to phase shifting techniques, the path has actually led right back to white light. Scanning white-light interferometry combines the power of modern high-speed computers with the vast amount of surface information produced by white-light interferometry. This permits SWLI-based systems to measure surface features far larger than those measurable with conventional phase-measuring interferometry (PMI) techniques, with little sacrifice in resolution or speed.
Scanning white-light interferometry (SWLI) systems capture intensity data at a series of positions along the vertical axis, determining where the surface is located by using the shape of the white-light interferogram. White-light interferometric microscopes are useful for sectioning images according to surface height in a manner analogous to confocal microscopes but without the complexity and high cost of confocal instruments. The white light interferogram actually consists of the superposition of fringes generated by multiple wavelengths, obtaining peak fringe contrast as a function of scan position, that is, the red portion of the object beam interferes with the red portion of the reference beam, the blue interferes with the blue, and so forth. In other words, a prodigious amount of data is available in white-light interferograms.
Conventional SWLI systems use fringe contrast to yield surface height information. Frequency domain analysis (FDA) is an alternate approach that uses all of the information available in the interferogram. This Fourier analysis method is used to convert intensity data to the spatial frequency domain, allowing production of an accurate height map. The performance of SWLI-based systems using FDA analysis equals that of PMI for surfaces on the order of 10 µm rms roughness, yet the systems are capable of measuring features up to 10 mm in size, orders of magnitude larger than possible with PMI systems.
In an SWLI system, an imaging interferometer is vertically scanned to vary the optical path difference. During this process, a series of interference patterns are formed at each pixel in the instrument field of view. This results in an interference function, with interference varying as a function of optical path difference. The data are stored digitally and Fourier-transformed into frequency space.
At this point the original intensity data are expressed in terms of interference phase as a function of wavenumber. Wavenumber k is just a representation of wavelength in the spatial frequency domain, defined by k = 2p/l. If phase is plotted versus wavenumber, the slope of the function corresponds to the relative change in group-velocity optical path difference DG by
Dh = DG/2nG
where nG is group-velocity index of refraction. If this calculation is performed for each pixel, a three-dimensional surface height map emerges from the data.
Design of a scanning interferometer
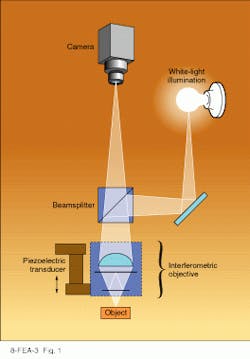
Three-dimensional imaging surface structure analysis can be performed with the Zygo NewView 100 scanning white-light interferometer. White light from a halogen source is sent through a beamsplitter prism and into the objective (the objective is actually an imaging interferometer). Inside it, a beamsplitter sends one portion of the source illumination to an internal reference surface while the main beam travels to the sample under test. The return beam reflected from the sample interferes with the reference beam and the resultant interferogram is captured by a 640 × 480-pixel CCD array.
In the actual measuring process, the optical path difference is steadily increased by scanning the objective vertically using a precision piezoelectric positioner. Interference data are captured at each step in the scan. In effect, an interferogram is captured as a function of vertical position for each pixel in the detector array. To sift through the large amount of data acquired over long scans, a patented technique involving both acquisition and processing algorithms is used. This method allows the instrument to reject raw data that do not exhibit the intensity variations that indicate white-light fringes.
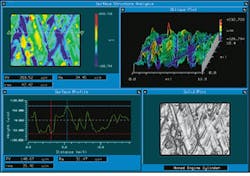
Using discrete Fourier-transform techniques, the intensity data as a function of the optical path difference are converted to the spatial frequency domain. The analysis is then conducted with MetroPro software for display with a variety of surface maps and numerical results (see Fig. 2).Both Michelson and Mirau interferometric objectives are offered. The compact Mirau design is suitable for turret mounting, but at lower magnification the Michelson configuration is more economical. Available objective magnifications range from 1.5X to 100X. A continuously variable zoom feature further extends this range and permits optimization of field of view (FOV) and magnification. The FOV range is 0.07 to 10 mm with maximum lateral resolution of just under 0.5 mm. The vertical scan length has recently been increased to as much as 10 mm with a theoretical resolution of 0.1 nm, though the actual resolution is bound by factors such as vibration and temperature fluctuations. Repeatability for the single measurement case is 0.6 nm rms, dropping to 0.3 nm rms for the average of eight samples.
Applications of SWLI
Engineers at Hewlett-Packard (Santa Rosa, CA) use the NewView 100 scanning white-light interferometer to perform surface metrology in several applications. Generation of calibration standards for microwave test equipment depends on an accurate measurement of connector impedance, which is in turn dependent on connecting pin depth. Hewlett-Packard metrology laboratory supervisor Wendell Anderson uses white-light scanning interferometry to accurately measure pin depth.
The instrument is also well suited to surface finish characterization of fiber connectors in manufacturing and research and development applications. Using low magnification permits engineers to characterize parts up to 8 mm in diameter. The best fit surface is removed from the data, leaving a surface error map. Because of the large field of view afforded by the method, HP engineers find it particularly useful for scratch-dig characterization.
The metrology lab also inspects fiberoptic connectors using SWLI systems. Anderson evaluates single-mode diamond connectors, inspecting them to make sure that the fiber is not protruding or recessed. Unlike the previous two examples, which require operator guidance and value judgements, this type of inspection can be made operator independent.
Researchers at the Center for Optics Manufacturing (COM, Rochester, NY) use the NewView 100 for pre- and post-fabrication cycle metrology to characterize optical surfaces. By correlating the surface microstructure of different materials subjected to identical fabrication cycles, researchers get a better understanding of the exact nature of the process (for example mechanical, thermal, and chemical). They can also estimate the progress of magneto-rheological finishing, a polishing technique under development at the center.
The large dynamic range of SWLI makes it particularly appealing for correlation studies of subsurface damage in grinding. Scanning white-light interferometry "does not require specular surfaces," notes Don Golini, manager of COM`s manufacturing sciences program. "That`s a huge advantage for us." According to Golini, the instrument is used to measure surface finishes from 5 Å rms to thousands of angstroms rms, making it suitable for a variety of applications beyond the few mentioned here.
FURTHER READING
P. De Groot and L. Deck, "Interferograms in the spatial frequency domain," J. Mod. Opt. 42(2), 389 (1995).

