Select a spectrometer suited to your task and environment
Many people have a limited understanding of the concept of spectroscopy, based on what they learned in high-school science. The breakup of white light by a glass prism is one of the most colorful and memorable aspects of the physics of light. Spectroscopy is the analysis of absorbed or emitted energy by matter across the electromagnetic spectrum. It can be used to identify a sample from its wavelength data and to determine concentrations, which are proportional to energy intensity.
When it passes through matter, light is absorbed by atoms and molecules at characteristic wavelength bands. Light emissions can include reflected radiation frequencies as well as the actual fluorescence of a material when excited by a light source. Fluorescence usually is produced with short-wavelength incident light and depends on the excitation wavelength as well as the material itself. The energy absorbed or emitted by molecular vibrations and rotations also can be analyzed through infrared and Raman spectra; these are especially useful with organic compounds.
Selection of an OEM spectrometer to analyze materials or monitor a process depends on the material and the operational environment. A research laboratory is a more benign environment than a factory floor, and data-acquisition rates may be less demanding for research investigations rather than in the production environment, where higher speed means greater efficiency. Several simultaneous spectra may be required, and a variety of detector types and configurations are available.
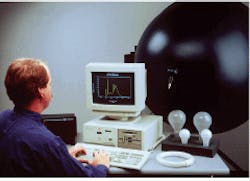
There are many uses for spectrometer systems, such as monitoring and inspection of industrial production processes for quality control. A waste stream can be observed to control material separation for recycling purposes. Light sources such as lasers, lamps, and light-emitting diodes have to be calibrated and monitored for aging effects (see Fig. 1). Color monitoring of paints and fabrics ensures consistency between production lots. And air and water can be analyzed for dangerous concentrations of pollutants.
This Product Focus discusses a representative group of OEM spectrometers. The table that follows samples several of the companies providing equipment and some of their devices and systems. It is not meant to be a comprehensive inventory. For such a roster, see the extensive five-page listing in the 1995 Laser Focus World Buyers Guide, beginning on p. 649. Prospective OEM buyers should contact each company for complete details of its products, selection guidelines, and system interface requirements.
Spectroscopy basics
Many types of spectroscopy require a light source—either a lamp or a laser—to generate an optical signal. Light emitted by a material under study is dispersed as a function of wavelength, usually by a grating, and falls on a detector. Or light of known frequencies can be absorbed when passing through an appropriately transmissive material. The light wavelengths emitted or absorbed reveal a sample’s chemical composition, and their intensities yield the concentrations. The most important consideration in selection of a spectrometer is the spectral range that must be covered to detect the desired elements.
A monochromator is a device that presents one wavelength, actually a narrow band of wavelengths, or bandpass, from its exit slit. Light enters the device through an entrance slit, is collimated, and is then spectrally dispersed. A movable exit slit allows selection of a desired output wavelength. Scanning monochromators drive the slit to scan a range of wavelengths, and polychromators have various exit slits and provide a fixed selection of wavelengths. Bandpass depends not only on the width of the entrance and exit slits but on grating width, system aberrations, and spatial resolution of any detector used.
Spectrometer gratings can be ruled or holographically blazed, or they can be holograms themselves. Ruled gratings are best with a groove density less than 600 lines/mm, which gives low stray light. Each line is ruled individually by a diamond stylus.
A holographic grating is formed all at once. Here a photosensitive master is placed on a photoresist-material-covered blank. Two laser beams then scan the master, forming an interference pattern that changes the composition of the blank. Chemical etching then results in a blank with sine-wave-like undulations for the grating rather than the sawtooth edges of a ruled grating.
Some monochromators, such as those from Oriel Instruments (Stratford, CT) and Instruments SA (Edison, NJ), have movable fixtures holding several gratings that can be moved into position as required. And, recently, three-dimensional volume holograms from Kaiser Optical Systems (Ann Arbor, MI) have begun to be used as diffraction gratings.
Monochromator designs
One of the most common monochromator designs is the Czerny-Turner type. In this device a concave mirror collimates the light input onto the grating. A second similar mirror refocuses the light reflected from the grating through the output slit. Another common type is the Ebert monochromator, which uses a single spherical-concave mirror to collimate and refocus the light.
The monochromator focal length is the distance between the input slit and the focusing component. Short-focal-length devices have enabled production of compact units. But, in general, the longer the focal length the greater the dispersion of light; that is, a nanometer of light is spread out further on the focal plane with a longer-wavelength device.
In a dual configuration, the output of one monochromator can be used as input to another monochromator to minimize stray light and enhance spectral purity. Stray light arises from diffusion by optical components, because no mirror or grating is perfect, and imperfections in the source input illumination as well.
Monochromators can be used as filters to select individual wavelengths from the spectrum of a light source, and these wavelengths can be used in irradiating a sample. Or the source light entering the monochromator can be analyzed using a detector behind the exit slit to record the spectrum as the slit is moved.
A spectrograph is similar to a monochromator but does not have an exit slit. Instead, wider dispersed spectral bands result, usually to fall across the surface of a multichannel detector. Some spectrographs feature two exits. One of these will have a slit so the device can serve as a monochromator as well.
Imaging spectrographs have corrective optics that focus the source radiation on the exit plane of the device, and, thus, an image of the input slit is formed. The difference between an imaging and a conventional spectrograph can be demonstrated using a monochromatic light source focused on the input slit that is then partially covered. With the conventional spectrograph, a decrease in intensity is seen at the output plane with very little spatial difference in the resulting "focused" line. Optics in an imaging device focus the source so the focused image duplicates the shape of the entrance slit—covering half the input reduces the output image by half, with the same proportions.
This input/output relationship allows measuring of multiple samples simultaneously. For example, with an imaging spectrograph, two fibers carrying the monochromatic light of the same wavelength placed at the input slit will produce two distinct spot images above and below each other at the output plane. A nonimaging spectrograph would show the outputs merged into a single line output.
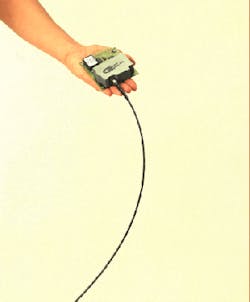
Fiberoptics sampling flexibility permits delivery of light to spectrometers with less complex optics and, along with microelectronics and optics, allows for compact modular devices. These even include instruments, such as those produced by Ocean Optics (Dunedin, FL), that are small enough to fit on a PC board (see Fig. 2). Acousto-optic tunable crystal filters, such as those from Brimrose (Baltimore, MD), allow ultrasonic tuning of near-infrared light sources without any movable parts, which is convenient for a taxing factory-floor production environment (see Laser Focus World, August 1994, p. 87).Selection criteria
The spectroscopic characteristics of the substance being monitored determine the wavelength range needed. Most colored material can be identified with ultraviolet or visible light—UV for biological fluorescence, near-IR for pharmaceuticals, and IR for organics, plastics, and engineered materials.
Once the desired wavelength range for a spectrometer is determined, consideration has to be given to spectral resolution, which determines the ability to separate adjacent spectral lines. A perfect monochromatic source passed through a perfect spectrometer would produce a spectrum identical to the input—a single- wavelength line at exactly the same wavelength. In reality, the single-wavelength line is broadened, forming a peaked intensity profile. This instrument profile is, in fact, determined for the spectrometer by using a fairly monochromatic light source. Bandpass is the full width at half maximum (FWHM) of this profile and serves to define it.
In optics theory, the Rayleigh criterion used to determine resolution of diffracted point sources of light states that their diffraction peaks are just resolved if the peak of one coincides with the first diffraction minimum of the other. In spectroscopy, the Rayleigh resolution criterion is typically expressed as the wavelength difference between adjacent spectral line peaks when the FWHM points of the two intensity profiles coincide. Mike Case, marketing manager for Acton Research (Acton, MA), gives the following example. "If resolution of 0.1 nm is desired, the peaks of the two lines must be within 0.1 nm apart when their 50% points cross, assuming a mostly symmetric intensity distribution." This would be for a typical 0.25-m-focal-length spectrometer and 10-µm × 4-mm slits. If a detector with pixel elements is used, then the minimum resolution is limited to the distance between two adjacent pixels.
The wavelength accuracy of the spectrometer (that is, the accuracy of the wavelength values attributed to an output spectra) depends on the accuracy of the position of the readout elements such as the slit or detectors. Repeatability and long-term stability of measurements depend on the mechanical stability of the device as well as the wavelength drift caused by temperature changes.
Intensity resolution of spectrometer output depends on detector type and involves issues such as the smallest detectable changes and the lowest absolute amount of detectable energy, dynamic range, signal stability, and linearity. Dynamic range corresponds to the saturation intensity versus noise value (signal-to-noise ratio) and goes down with an increase in the dark current, which is even present when there is no input.
For some detectors, such as photo emissive photomultiplier tubes (PMTs), dark current increases with temperature and thus they may require cooling. In addition to PMTs, spectroscopic detectors include semiconductors, such as silicon photodiodes for ultraviolet, visible, and near-infrared wavelengths and solid-state infrared devices; thermal detectors based on pyroelectric materials; and two-dimensional arrays such as photodiodes and charge-coupled devices. Arrays have the advantage of detecting many wavelengths simultaneously and are thus suited for production process measurements or research involving rapid fluctuations in source radiation.
With infrared detectors, it may be necessary to eliminate unwanted background radiation by mechanically chopping the input signal. The detector is synchronized to the chopper reference frequency by a lock-in amplifier that then discriminates against the unmodulating background.
Customer hints
Other than feeling that a customer should have some basic knowledge of spectroscopic issues, most OEM suppliers say selection of the needed system is a fairly individual, customized, but straightforward, process.* Suppliers can directly define or recommend a system once a prospective user details its end use, under what environment it will be used, and what data rates and storage are required.
Modern spectroscopy systems allow taking the laboratory into the field for more timely data turnaround and greater personnel efficiency. More versatile laboratory analyses are possible as well as applications on the factory floor for direct process monitoring and quality control.
*Publications that provide background on spectroscopy and detail specific systems are available from industry manufacturers and suppliers. Prospective users may want to start with the following:
Guide for Spectroscopy, Instruments SA, Edison, NJ; New Products for Light Research, Oriel Instruments, Stratford, CT; MMS Spectral Sensors, Carl Zeiss, distributed by Hellma Cells, Forest Hills, NY.
A representative listing of manufacturers of spectrometers begins on p. 148.
About the Author
Rick DeMeis
Associate Editor, Technology
Rick DeMeis was Associate Editor, Technology for Laser Focus World from March 1995 through March 1997.

