BIOSPECTROSCOPY: Deep-UV Raman spectroscopy directly probes a fibrillation nucleus
VICTOR SHASHILOV AND IGOR K. LEDNEV
Amyloid fibrils-insoluble protein chains that aggregate in biological tissues-are implicated in Alzheimer’s, Parkinson’s, and many other devastating diseases. Understanding the biochemical mechanism of amyloid fibrillation is one of the most intriguing and pressing problems in modern biology and medicine.1 It is well accepted now that fibrillation starts with the formation of an unstable protein species called nucleus. Once the nucleus is formed it rapidly grows into a mature fibril composed of the highly regular protein structure called “cross β-sheet.”2 Understanding the mechanism of the nucleation, a limiting stage of the pathological process, is crucial for the development of drugs to fight devastating diseases.
Direct examination and structural characterization of the fibrillation nucleus is challenging because of its inherently low concentration. So far, the characterization of the nucleation step has relied on a few oblique methods that can probe only the late stage of fibrillar growth. Thioflavin T florescent dye is often used as an indicator of fibrillation in solution. However, it is sensitive to mature fibrils only and not to the nucleus. Similarly, dynamic light scattering (DLS) tends to overlook the very onset of the fibrillation process as the method confidently detects only large fibrillar aggregates.
Deep-ultraviolet resonance Raman (DUVRR) spectroscopy exhibits unique sensitivity to protein secondary structures and confidently distinguishes main structural elements including α-helix, β-sheet, and random coil conformations.3 Cross β-sheet is a specific type of highly regular β-sheet found in amyloid fibrils.4 The distinctive DUVRR spectral signature of fibrillar cross β-sheet has allowed our team at the University at Albany to focus on the nucleation step of lysozyme fibrillation.5
Significant advances in laser technology, microfluidics, and the development of novel light detectors have dramatically improved spectroscopic methods for molecular characterization over the last decade. In many cases, nanoliter samples are sufficient for high-quality spectroscopic characterization that opens the possibility of working with precious biological and chemical systems. Although the accumulation time is significantly reduced in a typical measurement, the amount of information hidden in digital data sets composed of hundreds and thousands of points is dramatically increased. The once golden rule of previous generations of spectroscopists-that if you do not see a change in the spectrum by naked eye, then you are chasing a ghost-no longer applies. Advanced statistical methods allow the retrieval of qualitative and quantitative information from data sets that is not otherwise evident. For example, we extracted Raman spectroscopic signatures of protein intermediate states, which form at the early stages of lysozyme fibrillation, by utilizing latent variable analysis without any prior information.6 We also applied DUVRR spectroscopy combined with advanced statistical analysis including two-dimensional (2-D)-correlation spectroscopy, independent component analysis (ICA), and pure variable methods, to study nucleus formation during the fibrillation of hen egg-white lysozyme, a well-studied model of amyloidogenic proteins.7
Protein characterization using DUVRR
Deep-UV excitation (below 200 nm) resonantly enhances Raman scattering from the amide chromophore, a building block of a polypeptide backbone, exhibiting a strong UV absorption peak at approximately 195 nm. The resonance enhancement not only decreases the required sample amount, but also allows for probing specific structural motifs of a protein molecule. The amide chromophore Raman signature provides direct quantitative information about the secondary structure of proteins. Vibrational bands of aromatic amino acids, tryptophan and tyrosine, have been shown to be responsive to contacts between secondary structure elements and exposure to water and, consequently, are used for characterizing the tertiary structure of proteins.
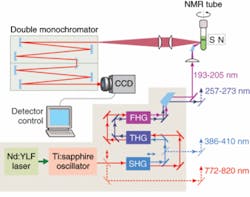
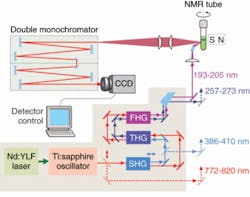
A new deep-UV Raman spectroscopic apparatus utilizing a laser source tunable between 193 and 205 nm was specifically designed for DUVRR protein structural characterization (see Fig. 1).8 A 197 nm, 1 mW Indigo-S laser system from Coherent (Santa Clara, CA) is focused into a spinning nuclear magnetic resonance (NMR) Suprasil glass tube containing 150 μL of solution. Scattered radiation is collected in backscattering geometry, dispersed using a home-built double monochromator, and detected with a liquid-nitrogen-cooled CCD camera.
Lysozyme, a well-characterized model protein which readily forms fibrils under certain conditions, was used in our fibrillation studies. Continuous incubation of lysozyme solution at pH 2.0 and 65°C resulted in the formation of increasing amount of insoluble fibrillar aggregates. We hypothesized that the fibrillation nucleus should remain in solution all over the incubation, so the portions of lysozyme solution at different incubation times were separated and analyzed using the DUVRR spectrometer. The presence of the nucleus in our samples turned out to be absolutely conclusive as those samples caused immediate fibrillation on addition to lysozyme. The latter is contrasting to a typical delayed fibrillation where the nucleus is yet to be formed.
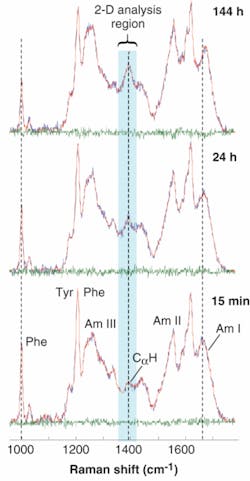
The DUVRR spectra for lysozyme incubated for various times exhibit pronounced amide bands related to protein secondary structure. The major protein Raman bands are conventionally called Amide I, Amide II, Amide III, and a CαH bending band (Fig. 2). They all arise from the complex vibrational motions of the amide group atoms and change in shape and frequency when the structure of a protein changes. The Tyr and Phe labels designate Raman peaks originating from the side chain groups of Tyrosine and Phenylalanine amino acid residues, respectively.
Per the DUVRR spectra plots, the CαH bending band intensity increases with the incubation time, indicating the melting of α-helix and the formation of β‑sheet and random coil. The development of a new β-sheet was also evident from the apparent sharpening of the Amide I band. The pronounced decrease in the 1000 cm-1 phenylalanine band intensity during the incubation corresponds to melting of lysozyme tertiary structure. Although the formation of random coil and β-sheet was evident from the experimental spectra, the temporal order of the two processes could not be established by the visual inspection of the data. Specifically, random coil and β-sheet could develop either simultaneously or in a step-by-step fashion, thus leaving a dilemma about the actual nucleation mechanism.
Probing sequential nucleation events
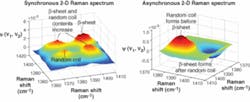
A special numerical approach called 2-D correlation analysis was invoked in order to decide between two alternative nucleation mechanisms. In the 2-D correlation method, the sequential order of biochemical processes is established based on the analysis of intensities in the spectral regions representing individual biochemical or structural species. The CαH bending DUVRR region contributed by β-sheet (approximately 1396 cm-1) and random coil (approximately 1387 cm-1) peaks was selected for 2-D correlation studies in order to distinguish the highly correlated processes of random coil and β-sheet formation. Synchronous Φ(ν1,ν2) and asynchronous Ψ(ν1,ν2) 2-D Raman spectra were calculated following Noda’s approach (see Fig. 3).9
The two positive peaks at 1396 or 1387 cm-1 on the synchronous 2-D correlation spectrum Φ(ν1,ν2) indicate a strong temporal correlation between the formation of β-sheet and random coil. The asynchronous 2-D Raman correlation map shows a peak and valley centered at 1385 and 1400 cm-1, illustrating that the formation of a β-sheet was delayed with respect to the formation of random coil. This result unambiguously establishes a partial correlation between the formation of β-sheet and random coil, and the sequential order of their appearance. Consequently, this allowed us to distinguish between two alternative mechanisms of β-sheet formation.
In a parallel process mechanism, random coil and β-sheet are produced directly from the native protein and should be completely correlated. In a step-by-step mechanism, β-sheet develops from the partially unfolded intermediate. In the latter case, the formation of β-sheet and the partially unfolded intermediate could correlate, but only partially. Consequently, the step-by-step mechanism proposed by Dobson and coworkers was in complete agreement with our analysis.10
Following the proposed mechanism, the newly formed β-sheet in the solution part of the incubated samples was provisionally assigned to the fibrillation nucleus. The rigorous quantitative characterization of the step-by-step nucleation mechanism calls for evaluating all reaction-specific characteristic times providing that the evolution profiles and DUVRR spectra of all reacting species are known. The evolution profiles and the DUVRR spectra of the reacting species were extracted using state-of-the-art curve multivariate resolution methods such as independent component analysis (ICA) and model-constrained alternating least squares.
Our studies show that DUVRR spectroscopy, combined with 2-D correlation spectroscopy, ICA, and advanced modeling, is a powerful tool for the quantitative characterization of protein structural rearrangements and could be used for various protein folding problems.11, 12
REFERENCES
1. F. Chiti and C. M. Dobson, Annual Rev. Biochem. 75, 333 (2006).
2. R. Sabaté et al., Int’l. J. Biological Macromolec. 35, 9 (2005).
3. I.K. Lednev, Protein Structures, Methods in Protein Structures and Stability Analysis, Nova Science Publishers Inc. (2006).
4. M. Xu et al., Biopolymers 79(1) 58 (2005).
5. M. Xu et al., J. Am. Chem. Soc. 129(36) 11002 (2007).
6. V.A. Shashilov et al., J. Quant. Spectroscopy & Radiative Transfer 102, 1, 46 (2006).
7. V.A. Shashilov et al., J. Am. Chem. Soc. 129(22), 6972 (2007).
8. I.K. Lednev et al., Analyt. Bioanalyt. Chem. 381(2) 431 (2005).
9. I. Noda and Y. Ozaki, Two-dimensional correlation spectroscopy: applications in vibrational and optical spectroscopy,John Wiley & Sons, NJ, p. 295 (2004).
10. D.R. Booth et al., Nature (London) 385(6619), 787 (1997).
11. V. A. Shashilov et al., Inorganic Chem. 45(9) 3606 (2006).
12. M. Xu et al., Protein Science16(5) 815 (2007).
Tell us what you think about this article. Send an e-mail to [email protected].
VICTOR SHASHILOV is a graduate student and IGOR K. LEDNEV is an assistant professor in the Department of Chemistry at the University at Albany, The State University of New York (SUNY), 1400 Washington Ave., Albany, NY 12222; e-mail: [email protected]; www.albany.edu.


