Customized algorithm automates textile shrinkage measurement
By Hamed Sari-Sarraf, Eric F. Hequet, Noureddine Abidi
A recently developed machine-vision system provides accurate and reliable shrinkage or growth measurements, independent of changes in texture or color of fabric samples, changes in benchmark colors, and slight sample rotations during the scanning process.
In the textile industry, the degree to which a fabric can be expected to shrink or expand during laundering is an important factor in determining its value. To evaluate a knitted or woven fabric for shrinkage, a technician usually cuts a swatch from the cloth, marks it through a standard template and tosses it into a washing machine. After several washing and drying cycles, the technician measures the distance between the marks with a ruler to determine if the fabric has shrunk or stretched, and if so, by how much.
The American Association of Textile Chemists and Colorists (AATCC) has developed a standard protocol for this manual procedure known as Test Method 135.1 For the last quarter of a century, attempts to remedy the inherent inefficiency and subjective inaccuracy of this test method through automation have all succumbed to various limitations that have rendered these automation schemes impractical for everyday use in the textile laboratories.2, 3 Those limitations have included requirements for extensive sample handling or for a priori specification of benchmark colors.
With partial funding from Cotton Incorporated (Cary, NC) and the Texas Food and Fibers Commission (Austin, TX), however, and with support from the International Textile Center (ITC) at Texas Tech University (Lubbock, TX) our research group has used image-processing techniques to develop an automated method for measuring shrinkage. The method has successfully completed about a year of live testing in textile industry laboratories.
Our machine-vision system uses low-cost, commercial, off-the-shelf hardware components and a customized image-processing algorithm to capture digital images of premarked fabric swatches and to accurately measure the distance between operator benchmarks before and after laundering. The system hardware consists of a standard PC and a desktop color scanner or a color digital camera. The scanner can be used to obtain digital images of smaller samples (20 cm or less), while the camera has to be used for larger samples.
The ability to obtain accurate and reliable measurements with this system is not affected by changes in the texture or the color of the swatches, interfabric changes in the benchmark colors, or changes in the fabric contrast due to scanning or laundering, presence of noise, or slight rotations of the fabric during scanning.
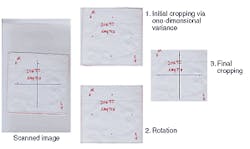
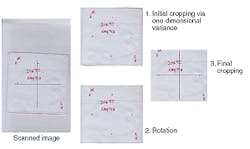
Using the automated system, a technician can take a swatch of cloth, benchmark it, and put it on a commercial scanner. The scanner scans the cloth and generates an image. The software automatically rotates the image to the correct orientation, so the technician need not worry about precise sample orientation on the scanner bed. The system also crops the image to ensure that only the cloth is included and that any portions of the scanner bed are excluded (see Fig. 1). The rotated and cropped image is then passed on to the benchmark-detection algorithm.
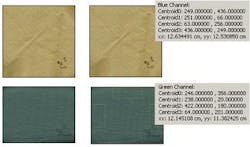
The benchmark-detection algorithm works in several steps. First it locates regions of interest around areas of the fabric where benchmarks are likely to be present (see Fig. 2). After neighborhood averaging within these regions of interest, it uses a Nagao filter to increase the benchmark-to-fabric contrast by noting and accentuating color variances in heterogeneous regions that contain both marked and unmarked fabric.4 In the third step, the marks are detected using a local variance operator. Finally, relevant features (such as size, disposition, and color) are measured and a rule-based classification technique determines the absence or presence of the benchmarks within the regions of interest.
During the third step, the color image is split into its red, green, and blue components, and all subsequent operations are performed on all of these components individually. This individual and parallel color processing provides the amount of information needed to distinguish benchmarks without a priori knowledge of either benchmark or fabric color. Consequently, the algorithm would not work with a black-and-white scanner or a grayscale image from a color scanner.
During about a year of routine testing at ITC and Cotton Incorporated under realistic test conditions and over a variety of fabrics, the algorithm has operated reliably, accurately, and rapidly, with an execution time on the order of one or two seconds.
In a preliminary case study, the detection algorithm was tested on 30 samples, including five commodity fabrics (fleece, twill, jersey, oxford, and pique) with five different colors. The digital images of the smaller samples were captured using an off-the-shelf scanner, while those of the larger samples were obtained with a digital camera. In every case, the algorithm successfully detected the benchmarks, with an average correlation coefficient of 0.98 to manual measurements.
In another case study, 54 fabric specimens with compositions including 100% cotton, cotton/polyester, cotton/wool, cotton/mohair, polyester/rayon, and wool were divided into three groups, and a different cleaning technology (including dry cleaning) was applied to each group. Once again, the detection algorithm successfully detected the locations of the benchmarks in every case with a strong correlation to manual measurements.
The next major step for the project, which has already been started with funding from Cotton Incorporated, is to assess fabric for wrinkles after laundering. The AATCC has six different grades for wrinkles. So in addition to assessing wrinkles in a fabric, the system will also have to assign grades. The problem is a great deal more complicated than assessing shrinkage, and after a year and a half of work, several issues have been solved and more remain to be solved.
In the coming months, our group hopes to attend an AATCC technical meeting with representatives of Cotton Incorporated to propose that our automated shrinkage assessment procedure be considered as a replacement for the current manual standard.
REFERENCE
1. AATCC Technical Manual 135-1995, 230 (1999).
2. S. J. Louisnathan, Method and System for Measuring Optical Distortion, U.S. Patent No. 5,812,260 (1998).
3. L. Norton-Wayne, Method and Apparatus for Measuring Length on an Article, U.S. Patent No. 5,315,666 (1994).
4. M. Nagao and M. Takashi, CGIP 9, 394 (1979).
ACKNOWLEDGMENTS
The author expresses his gratitude to Cotton Incorporated and the Texas Food and Fibers Commission for their partial funding of this research project.
HAMED SARI-SARRAF is an assistant professor in the Electrical Engineering Department at Texas Tech University, Box 43102, Lubbock, TX 79409-3102; e-mail: [email protected].
ERIC F. HEQUET is assistant director and NOUREDDINE ABIDI is head of chemical research at International Textile Center at Texas Tech University.


