Performance monitoring saves time and money
by Lawrence Green
Modern source monitoring of the laser beam is a valuable tool when characterizing and verifying industrial laser performance. It is a quantitative method, it saves time when tuning and adjusting the laser for specific applications, it can reduce waste by allowing the operator to halt production whenever the laser fails to meet the specified performance level, and it can improve the profitability of the process. Source monitoring is far more accurate than old, nonelectronic methods such as burn papers or acrylic mode burnseven the least-sensitive device can display 256 intensity levels and most of the newer techniques operate in real time, which allows display of short-term fluctuations of the laser beam. This capability all but eliminates the time-consuming trial-and-error method of adjusting a laser.
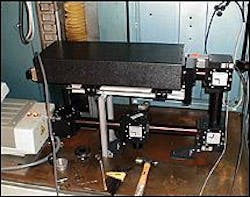
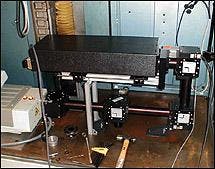
The technology for source monitoring falls into three basic categories. First and most common is simple at-line beam profiling. The second category combines beam performance calculations, such as the divergence and m2 to the at-line instrumentation, often supplemented by measurement of the temporal profile and total power. Last, in-line laser-beam performance monitoring combines the technologies of the first two categories and can be used continuously while the industrial laser is processing material (see Fig. 1).
At-line beam profiling
An at-line laser-beam monitor uses either electromechanical or electronic imaging techniques so that the technician can view the spatial profile of the raw laser beam. One challenge, however, is to have a reliable and accurate means of sampling the beam. This becomes difficult for higher-power lasers, because traditional beamsplitters are unable to handle the high power without introducing aberrations due to thermal lensing. While the electromechanical profiling systems can handle high power, they do not give real-time results.
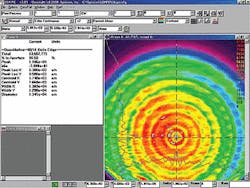
Once the beam has been properly sampled, it is important that the software employed in the beam profiling can accurately and reproducibly display the subtleties necessary to characterize the beam. Many modern beam-profiling software packages now include calculations such as diameter as well as location of the beam centroid and pointing stability, both extremely useful when tuning and adjusting a laser (see Fig. 2).
At-line beam characterization
Although beam profiling systems offer the ability to image the beam in real time, they still fall short when attempting to fully characterize the laser beam because they can provide only basic beam characterization parameters. While beam width, position, and pointing stability can characterize a laser beam, only m2 enables a user to quantitatively evaluate the focusing ability of the beam. The m2 measurement compares the beam to a perfect Gaussian single-mode beam and predicts the focused spot properties. Typically, when laser modes other than the fundamental Gaussian are present, the beam does not focus as sharply. When the beam consists of multiple modes, the spot size is m2 times larger than would otherwise be obtained, and the intensity of the beam at the waist becomes m2 lower than expected.
The energy from the laser is usually focused to a small spot for industrial (drilling and welding) and scientific applications so that the high-intensity light interacts with matter. In industrial drilling applications, the hole widths can be m2 larger than desired and cannot penetrate as deeply as would be the case with a pure beam. In scientific applications, the experiment often depends upon the intensity squared or cubed, which would create an error of (m2)2 or (m2)3 in the expected results.
For this reason, many companies now offer laser-beam characterization instrumentation, which adds the ability to calculate the beam divergence and the beam focusing-ability factor m2 to the spatial profile. The advantage of divergence measurements is clear when one understands that the beam divergence is directly related to the focused spot size in the main beam (see "The arithmetic of beam analysis," p. 73). Now, the technician can adjust the laser for the best intensity profile for a particular process, and tune the laser until the proper divergence angle has been achieved. At this point, the laser is tuned to its maximum performance.
In-line performance monitoring
Unfortunately, until recently these systems were only available for at-line operation, meaning that the process had to be interrupted while the technician performed the measurements and adjustments. With the advent of in-line instrumentation, the user now has the ability to determine the performance of the laser in real time and to make informed decisions if the performance deviates from a set standard.
When dealing with multiple-kilowatt laser beams, care has to be taken so that the sampled beam is an exact duplicate of the main beam. For portable at-line applications, the beamsplitting mirrors have to be large and robust enough to accept the beam diameter and energy of the main beam. This makes them bulky and heavy, and in some cases can include cooling liquids to keep the splitters from distorting, which makes such a system difficult to transport, set up, and align. In-line beam monitoring has permanently mounted beamsplitting mirrors.
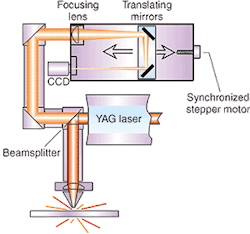
To make in-line beam monitoring a reality, new beam-sampling technology was developed, in which the main beam-sampling mirror is permanently mounted in the primary beam path. It eliminates the set-up time necessary with at-line instrumentation, and does not interfere with the process. The main beam-sampling mirror extracts only 0.4% of the incoming beam energy, returning 99.6% of the energy to the process, and the sampled beam is an exact representation of the main beam that can be directed into the instrument for analysis.
A data acquisition and control system based on this technology has been developed for industrial Nd:YAG lasers and can be mounted in-line, while still providing portability between lasers in the facility (see Fig. 3). The new system automates beam profiling, divergence, and m2 measurements, and it provides real-time analysis of the beam divergence and beam profile. User-selectable limits cause the system to alert the operator whenever they are exceeded. Use of prealigned quick-connect optics allows the system to be moved from laser to laser quickly and easily.
Modern laser production shops can realize performance gains and cost reductions by using any combination of these three classes of instruments. In addition, fine detail not previously seen is often the deciding factor between outstanding and just average performance. Calculation techniques can help match one laser to another in the same shop, reducing the time to retune and adjust the laser, and keep objective evidence for ISO 9000 audits. Finally, trend analysis of the data can facilitate the scheduling of preventive maintenance at their convenience.
Lawrence Green is industrial product sales manager at Spiricon Inc., 2600 N. Main St., Logan, UT 84341; e-mail: [email protected].
The arithmetic of beam analysis
The m2 value is directly related to the beam divergence by the following equation:
θ0 = M24λ/πW0
Where θ0 is the beam divergence in milliradians and W0 is the width of the input beam at its waist. In order to obtain the values for m2 and W0 , a long focal length lens is placed in the sampled beam path, and the ISO 11 146 method is followed. The data is then fit to the propagation equation, from which these values are obtained. Once the m2 and W0 are known, the width of the focused spot, w0 can be predicted, since
w0= M24λf/πW0
This is not a real-time measurement, however. Fortunately, both the focused spot size, w0, and the beam divergence, θ0, are proportional to the ratio of the m2 divided by the input beam width, W0 (see the first equation). The beam divergence, θ0, is calculated by measuring the beam width, wf, at one focal length f, from a focusing lens, divided by the focal length of the lens. This measurement can be performed in real-time, enabling continuous monitoring of any changes that affect the focused spot size, w0.
Because any change in the divergence angle means that either the m2 or the input beam width, W0, must have changed, the focused spot size will have changed as well. Rerunning the ISO 11 146 method will determine the new values of m2 and W0, so the operator can determine what action to take to return the laser to peak performance.


