Keeping an eye on everything
Network downtime and congestion result in financial losses for users and revenue penalties for carriers. The performance of optical networks, and specifically those that use dense wavelength-division multiplexing (DWDM), has for some time been characterized by the bit-error rate (BER) of data transmission. While BER measurements will always be a primary gauge of network performance, as transmission speeds increase, BER alone is no longer a sufficient guarantee of the quality of service.
Defining the need
The BER does not monitor the health of the numerous amplifiers, multiplexers, switches and other connections to the optical fiber, nor does it examine the health of the fiber itself. Looking for the first telltale signs of degradation in network components can only be done through analog optical detection. Likewise, a variety of phenomena within the fiber itself that adversely affect signal quality must be detected optically. These include chromatic dispersion, in which the differences in the refractive index of the fiber over the data bandwidth produce a spread in pulse widths; polarization-mode dispersion, which refers to the differences in the refractive index experienced by the polarization states of the optical signal (see Laser Focus World, November 2002, p. 115); and four-wave mixing, a nonlinear effect resulting from the tightly constrained multiple wavelengths within the fiber core.
Component-related problems that can contribute to signal degradation include amplifier noise, primarily amplified spontaneous emission (ASE), which accumulates from amplifier to amplifier in a network; crosstalk, in which signals from one channel within a multiplexer act as sources of noise for other channels; and the optical components themselves can degrade over time and with variations in temperature or humidity.
The function of a performance monitor
An older form of optical monitoring uses a "pilot tone," a low-frequency amplitude modulation impressed across all of the DWDM channels and then measured at the nodes of the network. A similar function can be performed by adding a "supervisory wavelength" to accompany the data transmission channels. Both of these methods suffer from the shortcoming of being unable to provide information about a specific channel, and they may even serve as a source of noise themselves.
An optical-performance monitor (OPM) extracts a small percentage of the optical power from a network fiber and separates the signals into individual channels according to their wavelength—that is, the transmission is demultiplexed. The OPMs use either a Fabry-Perot interferometer or a diffraction-grating-based optical-spectrum analyzer together with a photodetector array to perform demultiplexing. If the diffraction-grating approach is used, there are a variety of designs of either the conventional grating type or of gratings impressed directly into an optical fiber.
Optical-performance monitors directly measure optical power, wavelength, and signal-to-noise ratio (SNR) for each channel, and derive from these a number of parameters, including channel-wavelength drift, ASE noise, amplifier gain and gain tilt, and the Q-factor of a channel signal. These and similar parameters are then used for power equalization, wavelength locking, long-term monitoring, and fault identification, among other functions.
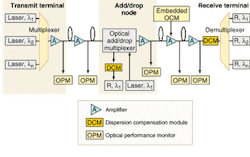
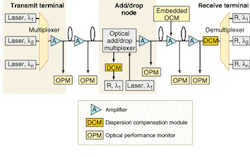
For DWDM systems with channels spaced only 50 GHz apart, the wavelength of each channel must be maintained to within ±0.05 nm, and the power level in each channel held to ±0.5 dB. To perform its measurements, the OPM itself should be able to supply optical power that meets these criteria at levels from -10 to -55 dBm for every network wavelength, and with the ability to change the polarization of the test beam. This capability enables an OPM to make measurements at all of the critical points in the network (see Fig. 1).
The dynamic range of an instrument is defined as the ratio of the highest to the lowest value that it can measure. The lowest power level, and hence the dynamic range, of an OPM is determined by its success at keeping the crosstalk between channels under test to a minimum. The OPM crosstalk comes from both optical and electrical sources within the instrument. Optical crosstalk values of -25 dB are typical. Lower values are possible, but with tradeoffs in both instrument size and cost.
Putting OPMs to work
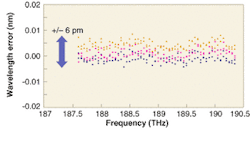
Optical-performance monitors are used in both metropolitan-area and long-haul networks, over the three telecommunications bands (S-, C-, and L-bands) that operate between 1280 and 1620 nm. These bands are capable of delivering many hundreds of independent channels. As might be imagined, keeping track of three (at least) fundamental measurements and numerous derived parameters for hundreds of wavelengths is a software-intensive task (see Fig. 2).
The network-management software coordinates overall network performance. Data output from the OPM is in the form of various average measurements, and so is best suited to monitoring relatively slow changes within the network. Although performance monitoring greatly reduces the risk of a failure, it is not a compensating mechanism for system deficiencies.
Optical-performance monitors used as embedded equipment must be compact and reliable. The space available for installation is small and costly. The electrical interface should fit into the design of the existing system. Embedded components also need to perform in temperatures from 0°C to 70°C and relative humidity from 5% to 95%.
These monitors are often located at amplifier locations. In addition to checking on the ASE noise mentioned above, locating the OPM at the amplifier sites provides the feedback necessary to dynamically maintain a flat amplifier gain profile. This is essential because the spectral output of an erbium-doped fiber amplifier (EDFA) can be affected by variations in the input power.
Connecting to an optical network is done using add/drop multiplexers (ADMs). Since the function of these devices is to change the number of channels in a segment of the network, it should be expected that substantial variations in power could occur at these sites. An OPM might be teamed with a variable optical attenuator to maintain a consistent power level, in addition to monitoring device degradation.
It may happen that transmission is already being demultiplexed by another network element for some other purpose. In this case an optical-channel monitor (OCM), essentially a performance monitor operating on a single channel, may provide a simpler local monitoring solution. This lower-cost alternative can meet the needs of some specific applications, such as monitoring optical switches that are based on microelectromechanical systems (MEMS) technology.
Demultiplexing elements
Most OPMs use the diffraction grating and photodetector array combination for demultiplexing. Commercial units use any of a number of different gratings, and in particular gratings written into a fiber, including arrayed waveguide gratings, fiber Bragg gratings, and Echelle gratings. These instruments have no moving parts, and make efficient use of the optical power siphoned from the network. Conventional diffraction gratings are handicapped for use in OPMs to some degree by their size.
The array detector paired with the grating must have a photodetector element for each channel being tested. This can total hundreds of elements, and requires advanced array technology. As with other detector applications in the near infrared, indium gallium arsenide (InGaAs) is the material of choice. These detectors will begin to saturate at power levels around 0 dBm (1 mW), well within the possible measurement levels of some OPM applications, so the array detector electronics for the instrument must be carefully designed.
By contrast, OPMs that use Fabry-Perot interferometers for demultiplexing need only a single-element detector. Fabry-Perot based instruments have very low crosstalk and high wavelength resolution. These devices gain simplicity in the detector function by trading for complexity in the wavelength tuning function.
The two parameters that quantify the performance of a Fabry-Perot interferometer are its free spectral range (FSR) and its finesse. The FSR is a measure of the wavelength range over which the interferometer can be tuned. It is a characteristic of this instrument that it repeats its transmission bandpass at regular intervals.
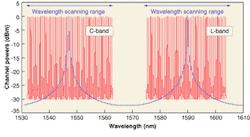
A Fabry-Perot interferometer with an FSR around 40 nm will both tune over the range of the C- or L-band, and also repeat its bandpass in the neighboring band (see Fig. 3). The ability of the interferometer to resolve a single channel within a band is specified by the finesse of the instrument. An interferometer with a finesse of around 500 will enable wavelength, power, and SNR measurements to be captured to the required accuracy.
Until recently, optical instruments capable of monitoring 40-Gbit/s DWDM networks did not exist, making management and maintenance of these systems difficult. New OPM instruments furnish providers with information on the reliability of the entire network—from verifying that components meet specifications at installation, to ongoing verification of the performance of a network over the course of its lifetime.


