Time and frequency measurements of light
Measurements of frequency and time are ubiquitous in science and technology. In optoelectronics, however, these measurements present a special challenge. The frequency of light at visible and near-infrared wavelengths is orders of magnitude beyond the ability of the fastest detectors to measure directly. Likewise the duration of optical pulses commonly used in many laboratory experiments is too quick for current technology to quantify precisely.
As a result, instruments designed to analyze signals at light frequencies or to measure ultrafast pulses rely on optical devices to convert frequency and time into measurements of length or intensity. The phrase "optical spectrum analyzer" refers to a number of different instruments designed to measure how the power in a signal is distributed as a function of frequency. There are three basic varieties of these instruments: those that use diffraction gratings, and those based on either Michelson or Fabry-Perot interferometers.
A choice of instruments
The Fabry-Perot interferometer was used soon after the laser was invented to study output spectra of the new device. Its most useful embodiment is the scanning confocal interferometer, which consists of a cavity, similar to many laser resonators, formed by two parallel, concave, and highly reflective mirrors. When an integral number of incident half-wavelengths resonate inside the cavity, it becomes highly transmissive. One of the mirrors is scanned by a piezoelectric transducer (PZT) to search for resonant wavelengths (see Fig. 1).
One disadvantage of such a resonant device is that, because different integer values can meet the resonant-cavity criterion, the same wavelength may appear multiple times as separately detected signals. The range of frequency that the interferometer can cover without duplicating a wavelength is called its free spectral range, or FSR. The FSR of a spectrum analyzer should be large enough to cover the signal spectrum.
The resolution of this instrument, which is determined by the reflectivity of its mirrors and their separation, is very high, allowing it to distinguish between narrowly spaced spectral lines or to measure their linewidth. Resolution appears in a figure of merit called "finesse," which is the FSR divided by the resolution. These instruments can resolve linewidths of less than a picometer (pm; 1/1000 of a nm) at wavelengths used in telecom applications. However the relatively narrow operating range of the scanning confocal interferometer makes it a less flexible instrument than spectrum analyzers that use diffraction gratings.
The resolution of diffraction grating-based instruments, while much broader at 100 pm to 10 nm, nevertheless is suitable for measuring the output of diode lasers used in telecom applications. The market size of this application makes these instruments the most popular optical spectrum analyzers. Diffraction gratings are used in a monochromator arrangement as the frequency discriminating element. Diffraction grating-based analyzers use either a single monochromator, a double monochromator, or a double-pass monochromator (see "Numbering the waves," Laser Focus World, August 2002, p. 141).
null
The wavelength tuning of the optical spectrum analyzer is controlled by the rotation of the diffraction grating, which causes successive wavelengths to be swept across the monochromator aperture. The aperture, although mechanically very simple, is a key component in the performance of the instrument. If the light beam at the aperture is narrower than the aperture slit, the instrument will not resolve the details of the spectra (the spectral line will appear to have a flat top).
A double monochromator design provides a greater degree of discrimination for closely spaced wavelengths; however, the signal after the second grating can be very weak. The double-pass monochromator provides discrimination similar to the double monochromator and signal levels similar to the single monochromator. In this design, after an order of the diffraction grating is passed through the aperture, it is reflected back to the grating for additional dispersion before being directed to the photodetector.
A mathematical foundation
The fact that the output of a monochromator is the convolution of the optical image with the aperture slit illustrates an important aspect of spectrum analyzers. The mathematical foundations of spectral analysis play a fundamental role in the design and operation of these instruments. Some of the most important tools derive from Fourier analysis, which states that virtually any periodic signal can be represented as a sum of sinusoidal waves of different frequency and amplitude. (In many situations, it can be said that the signal really is the physical sum of these components.)
Spectrum analyzers based on Michelson interferometers (sometimes called wavemeters) calculate the power spectrum of a light signal by taking the Fourier transform of a fringe pattern of interference created from the input light. The Michelson interferometer produces the fringe pattern by splitting the input light into two beams, creating a known delay in the path length of one the beams, then recombining the beams. The resulting interference pattern is the autocorrelation function of the input light.
By measuring the intensity of the interference fringes as the delay is varied, this type of analyzer can produce extremely accurate wavelength measurements. Moreover the Michelson interferometer can measure the coherence length of the input light, which other types of optical spectrum analyzers cannot do. These instruments cannot measure power at a given wavelength as a function of time, however, and also cannot measure the same dynamic range of power as analyzers that use diffraction gratings.
As an example of a spectrum analyzer application, consider the needs of a long-haul, high-speed optical network. The chromatic dispersion that accumulates over hundreds of kilometers of fiber can be considerable, resulting in a broadening of the digital waveform and the loss of data as pulses overlap. To minimize this problem, a narrow bandwidth optical-signal source, such as a distributed feedback (DFB) diode laser, is a vital element in such a network.
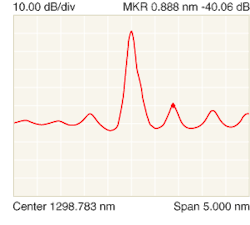
The spectral output of a DFB laser shows the main power lobe and the undesired side modes (see Fig. 2). The measurement was taken by an optical spectrum analyzer that uses a double-pass monochromator, which is well suited to the task of measuring a small spectral component located 0.5 nm or more away from the main spectral power component. Note the main side lobe that is more than 40 dB reduced in power from the central lobe. For greater spectral discrimination, a Michelson interferometer-based instrument would probably be chosen.
Network considerations
The speed of the signal in an optical network, (that is, the modulation of the carrier), is of course much reduced from the carrier frequency. When the signal has been demodulated, it is well within the measurement capabilities of conventional electronic instruments that use fast photodiodes, such as those made of alloys of indium gallium arsenide (InGaAs). The photodetectors themselves are designed for use either in the time domain or the frequency domain.
Frequency domain detectors are designed to have a flat response over the widest possible frequency range. These detectors can measure a narrowband signal anywhere within the specified range with virtually the same sensitivity. The tradeoff is that these detectors exhibit ringing, and so are poorly suited for use in the time domain.
Time-domain detectors are optimized to reproduce the shape of an incoming light pulse. They are characterized by fast rise times and absence of ringing. The tradeoff is that the response of the detector falls off as the signal increases in frequency. In general, one is interested in frequency domain measurements for engineering and design considerations, while time-domain measurements are used for the actual information transfer.
The optical time-domain reflectometer, or OTDR, is a kind of optical sonar used to test the transmission losses over a long span of optical fiber. The OTDR launches a pulse into a fiber and records the time it takes for the backscattered light to return (the speed of light in optical fibers is about 5 µs per km). The width of the pulse in the fiber is between 5 and 500 m, which defines the ability of the OTDR to specify a fault location (called an "event" in industry jargon).
FROGs in the lab
Instruments that measure time compare the duration of an event with the duration of a known standard. The problem with measuring ultrafast lasers is that for decades they have produced pulses that are orders of magnitude faster than anything available outside of high-energy particle accelerators. Indirect methods have been developed that make use of their extremely high peak power to deduce the duration of these pulses.
The autocorrelator is essentially a Michelson interferometer with the addition of a nonlinear crystal. After the pulse has been divided by a beamsplitter, varying the length of one of the arms of the interferometer creates a known delay in the path of one half of the pulse. The pulse is recombined in the nonlinear crystal, KDP (potassium dihydrogen phosphate) for example, where the high power produces a frequency-doubled pulse. The intensity of the doubled pulse is proportional to the overlap of the intersecting beams, which is maximized when the known interferometer delay matches the pulse duration. To arrive at a value of the pulse duration, the shape of the pulse must be assumed.
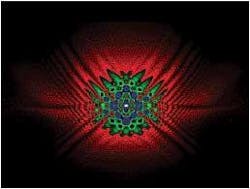
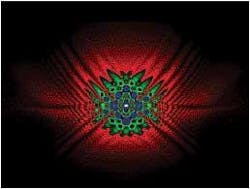
The autocorrelator cannot supply any information about the pulse shape, and tends to smear out any structure present in the pulse. To gain more information from the measurement, the frequency-doubled pulse can be directed into a spectrum analyzer. This arrangement, along with the algorithms for interpreting the data, is referred to by its developers at Georgia Institute of Technology (Atlanta, GA) and Sandia Labs (Livermore, CA) as a "frequency-resolved optical grating," or FROG (see photo, p. 125). The combination of these two instrumentalities promises a greater understanding of ultrafast technology, which itself is finding increasing use in a surprising variety of applications.
Next month's article in this series reviews the parameters and techniques used to measure laser beam profiles.


