Imaging spectrometer captures data in a flash
Imaging spectrometry provides spectral-signature data that can be used to deduce scene properties not accessible by eye or with conventional imaging sensors. A flash imaging spectrometer that incorporates computed-tomography techniques extends the technology further by providing a method for observing spatially and spectrally dynamic events occurring within a scene.
Imaging spectrometers are a class of instruments that remotely collect images with high spatial resolution over a large number of spectrally narrow channels (see Laser Focus World, Aug. 1996, p. 85). Typical bandwidths cover the visible/ near-infrared (VNIR) spectral region (0.4 to 1.0 µm) or the short-wave infrared (SWIR) region (1.0 to 2.5 µm). Instruments that operate in the VNIR and/or SWIR spectral ranges capture solar irradiance reflected by objects in the scene, while instruments designed for use from 3 to 5 µm and 8 to 12 µm capture the objects’ thermal radiance.
A trademark of hyperspectral imagers is the very large quantity of raw data that such instruments collect. The raw data are often referred to as image cubes, in recognition of the fact that the raw data can be viewed as a stack of spectral images. The size of a typical image cube can vary from tens of megabytes to gigabytes; the data-storage volume associated with a particular instrument imposes the size limitation.
Traditional dispersive imaging spectrometers collect image-cube data using some form of scanning. Two common methods are push-broom scanning, in which an area array detector is scanned along the landscape by the motion of an airplane or satellite, or whisk-broom scanning, in which a line-array detector is mechanically scanned perpendicular to the direction of travel of the instrument. Alternatively, imaging Fourier-transform spectrometers equipped with a focal-plane array at the output require scanning of the optical path difference between the two arms of a Michelson interferometer. Scanning methods of data collection are acceptable for static or nearly static scenes, but in the case of dynamic scenes, these methods generate spectral or spatial artifacts in the data. In the case of push-broom or whisk-broom scanning imaging spectrometers, scene motion causes spatial artifacts. In the case of spectrally multiplexing spectrometers, scene motion results in spectral-signature errors.
Computed-tomography techniques offer an effective method for overcoming these difficulties and for performing instantaneous, or flash, spectral imaging. Applications that call for this form of imaging can be found in astronomy, biomedical imaging, industrial testing, and in defense. For example, image-cube data acquired at rates of 30 Hz and higher can be used to enable and enhance high-speed target recognition and location.
Flash imaging spectrometer
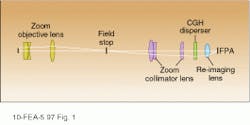
The computed-tomography imaging spectrometer (CTIS) consists of an objective, a collimator, a computer-generated holographic disperser, and a re-imaging lens (see Fig. 1). A zoom lens used as the objective al lows modification of the field of view of the instrument. The disperser is located in collimated space between the collimator zoom lens and the re-imaging lens. A second zoom lens can be used as a collimator to vary the magnification of the field stop onto the focal plane, in turn adjusting the effective dispersion within each diffraction order detected in the focal plane. The system focal-plane array is a 1000 × 1000-pixel charge-coupled-device detector that records snapshot spectral and spatial images of the scene.
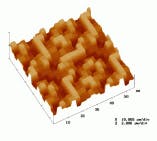
The computer-generated holographic (CGH) disperser, fabricated by Daniel Wilson and Paul Maker at the Jet Propulsion Laboratory (JPL; Pasadena, CA), was optimized to form a 7 × 7 array of diffraction orders at wavelengths within the bandpass of the CTIS (see Fig. 2). The focal-plane diffraction patterns for spectrally adjacent voxels overlap to a lesser degree in the higher orders than in the lower orders. Thus, the inclusion of higher diffraction orders in the raw image increases the spectral resolution of the instrument.
The diffraction efficiency associated with each diffraction order produced by the CGH disperser is inversely related to the dispersion associated with that order. For example, the diffraction efficiency in the zeroth order was designed to be lowest, the diffraction efficiency in the highest orders was designed to be greatest, and efficiencies of intermediate orders range between these two extremes. This weighting was designed to equalize the signal levels among all diffraction orders.
All CTIS components are fixed, that is, the instrument contains no moving parts. With the exception of the dispersive element, the current version of the CTIS consists of off-the-shelf optics. The instrument operates over the 430–710-nm spectral band with a 10-nm channel widths. The design can be adapted to other spectral ranges, such as 3 to 5 µm or 8 to 12 µm. In each case, the prerequisites are the availability of sufficiently large-format focal-plane arrays and a specialized dispersive element.
Understanding the data
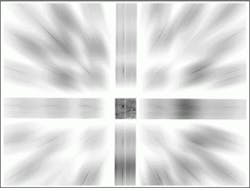
Conventional imaging spectrometers generate an image cube directly. The CTIS generates a complex diffraction pattern as the raw image, which must then be converted to a conventional image cube. The (x, y, l) image cube can be thought of as a discrete collection of spatial and spectral volume elements (voxels). In the CTIS, each voxel is mapped to the focal plane of the instrument through the optical elements and the disperser, so the image for each voxel consists of an array of diffraction orders (see photo at top of this page).
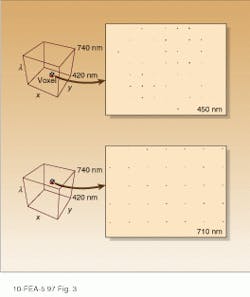
The diffraction efficiency of each order of the CGH disperser at a given wavelength determines the signal level associated with each spot in the focal-place diffraction pattern for voxels at this wavelength. As a voxel’s center wavelength changes, the resulting focal-plane diffraction pattern expands or contracts (see Fig. 3). At the same time, a spatial shift in voxel location creates a spatial shift in the corresponding diffraction pattern’s location in the focal plane.
The ensemble of diffraction patterns of all voxels describes the mapping of the scene from object space to image space. A raw image contains a superposition of voxel diffraction patterns. Reconstruction algorithms can map the signal detected at each pixel of the raw image into each voxel of the image cube.
Reconstruction of the (x, y, l) image cube is computationally intensive. The focal-plane array size, typically 1000 × 1000, determines the number of pixels in the diffraction pattern image. Information from these pixels must be mapped back to the desired image cube. For a system that is sampling the field of view over 64 × 64 pixels and 32 spectral channels, the image cube consists of 131,072 voxels. The reconstruction of the image cube from a raw image entails the inversion of a mapping from 131,072 voxels to one million detector elements. Fortunately, advances in desktop computing technology make this effort feasible in a research setting. Furthermore, the linear-algebra nature of the image-cube reconstruction algorithm suggests that the reconstruction processing can be parallelized and thus considerably accelerated.
Systems with the ability to acquire both spectral and spatial data in a snapshot have the potential to perform spectrally based target identification and tracking (see Fig. 4). This promise will be fulfilled if researchers can accelerate image-cube reconstruction algorithms. At present, reconstruction of a 10,368-voxel image cube requires 10 s to complete. The reconstruction task must take place in milliseconds if image cubes, rather than raw data, are to be collected at a video frame rate (30 frames/s).
Although it is speculative to generalize, most applications require data only from a subset or several distinct linear combinations of all the bands measured by a hyperspectral imager. In contrast, current imaging spectrometers operate in "discovery" mode, recording hundreds of contiguous spectral bands indiscriminately. For example, the Hyperspectral Digital Imagery Collection Experiment (HYDICE, built by Hughes Danbury Optical Systems, Danbury, CT, and operated by the Environmental Research Institute of Michigan, Ann Arbor, MI, for the US Navy) acquires data from 210 spectral bands; the Airborne Visible/Infrared Imaging Spectrometer (AVIRIS, built and operated at JPL) records 224 bands; and the TRWIS-III (built by TRW Space & Electronics Group, Redondo Beach, CA) records 384 bands. Reducing the size of image cubes requires on-board, application-specific processing techniques.
Spectral libraries
One of the major challenges in imaging spectrometry is fully characterizing scene content over a broad spectral range, from the visible to the infrared spectral regions. Scene content includes absorption, reflection, and thermal emission from natural and man-made materials under a variety of illumination and environmental conditions. The interpretation of high-resolution spectral data requires the creation of spectral libraries of absorption and emission spectra for various materials. Such libraries exist already but are limited in their scope. For example, libraries that emphasize natural scene content, such as vegetation and minerals, are relatively extensive. In contrast, libraries that emphasize man-made scene content, such as fabrics, paints, or construction materials, are still limited to a few samples per class.* The "discovery" operation mode of the current hyperspectral imagers, such as AVIRIS, HYDICE, and TRWIS-III, can augment laboratory measurements in filling out the hyperspectral picture of the world.
Imaging spectrometry provides extended insight into our environment. The potential for widespread use of information derived from hyperspectral image-cube data depends on our ability to interpret this newly available data. The computed-tomography imaging spectrometer collects spectral and spatial data of dynamic scenes at high speeds, but the raw data must be converted to image cubes to be useful. Now that the instrumentation challenge has been met, the next task is to reduce image-cube reconstruction times to below video-frame duration (33 ms) in order to use the data on a real-time basis.
* See, for instance, the Advanced Spaceborne Thermal Emission and Reflection Radiometer (ASTER) spectral library at http://asterweb.jpl.nasa.gov/speclib.


