UV lasers revolutionize Raman spectroscopy
UV lasers revolutionize Raman spectroscopy
Raman spectra of pollutants, diamond films, and proteins obtained with UV laser excitation provide new windows into chemical properties.
Sanford A. Asher, Calum H. Munro, and Zhenhuan Chi
New scientific instrumentation results in ever-more incisive explorations, which lead to deeper chemical and physical insights into materials. Possibly the best example of the coupling of instrumentation development and scientific advances is the impact of lasers on the understanding of molecular structure and dynamics. This continuing expansion of new laser sources fosters creation of new spectroscopic methods and the recreation of classical spectroscopic techniques that are used to guide the development of new concepts, materials, and technologies.
The recent development of ultraviolet (UV) laser sources has made possible experiments in UV Raman spectroscopy with applications to fundamental and applied studies in materials science and biology. Among these are studies of environmental carcinogens, diamond film growth, and protein structure and dynamics.
The normal Raman effect is a relatively weak phenomenon (see "Raman phenomenon scatters photons," p. 100). Until the 1980s Raman spectroscopy was considered an exotic technique, because it required highly dedicated practitioners who expended a great deal of effort to obtain spectra with high signal-to-noise ratios (S/N), informative of molecular structure. Monochromatic excitation sources relied on low-pressure mercury atomic-emission lamps. Typically, at least 10-h measurement times were required for highly purified, concentrated samples.
The development of lasers in the late 1960s revolutionized Raman spectroscopy because it became possible to easily focus the laser beam to create a high-fluence narrow-excitation region within a small volume of sample, which could be easily optically coupled onto the entrance slit of a spectrom eter. The accompanying development of shot-noise-limited electronic detection systems in the 1960s dramatically improved the S/N. Raman spectral measurements were now relatively easy to obtain, and a number of commercially available instruments became available.
The HeNe laser (638.2 nm) was the first commercially available laser to be routinely used for Raman excitation. It was quickly replaced by the higher-power argon (Ar) ion and krypton (Kr) ion lasers, which had `discretely tunable` excitation. These continuous-wave (CW) lasers had wavelengths throughout the visible spectral region and a few lines in the near-UV at greater than 300 nm. Temperamental at first, these systems evolved with painful persuasion by a few persistent manufacturers into reliable laser sources that became the standard for Raman measurements.
Multichannel detectors such as intensified reticon arrays and charge-coupled devices (CCDs) gave an S/N improvement of about 30, resulting from the thousandfold increase in the number of spectral resolution elements. An additional, occasionally even larger, increase in S/N also occurred with these detectors because all of the individual spectral resolution elements were simultaneously normalized to the incident laser fluence on the sample. Thus, temporal fluctuations in laser fluence, which were often a major source of noise in scanning instruments, disappeared as a noise source for Raman spectral measurements. This was especially important for the utilization of the now seemingly prehistoric low-duty-cycle pulsed lasers, which were notorious for shot-to-shot laser intensity fluctuations.
By the mid-1970s Raman spectroscopy appeared inherently straightforward. However, a major impediment--fluorescence from either the analyte or impurities--still remained. The weak nature of the Raman signal meant that trace amounts (~1010 less concentrated, for example) of highly fluorescent molecules could swam¥the spectral region that contained the Raman bands. Therefore, until the late-1980s, Raman spectroscopy was still considered a specialist`s technique--more an intricate and problematic toy of the physicist and physical chemist than a routine analytical tool.
Instrument revolution
Major developments during the mid-1980s dramatically changed this picture. Fourier-transform (FT) Raman using near-IR sources red-shifted the Raman spectra such that fluorescence was less of an interference, and it became possible to measure typical samples. The principal disadvantages of this approach were that the detectors were not shot-noise-limited and Fourier-transform encoding of the spectral information was required to obtain adequate S/N.
Another instrumentation revolution followed the development of Rayleigh rejection filters. The principal optical challenge in Raman instrumentation is to reject the dominant Rayleigh scattering while dispersing the Raman scattering onto the detector. The highly complex multistage spectrometers typically required for sufficient Rayleigh rejection, unfortunately showed throughputs of less than 8% (often below 3%). Holographic notch filters1 and crystalline colloidal array2 filters made it possible to use single spectrographs with throughputs of around 50%.
These spectrometers, coupled with multichannel detectors and a new series of commercially available, modestly priced visible Ar-ion and Kr-ion lasers, frequency-doubled Nd:YAG lasers, and red-emitting diode lasers, spawned new, modestly priced, and user-friendly Raman instrumentation. This new generation of instrumentation helped to establish Raman as a routine analytical technique, so it is now being adapted for numerous industrial process-control applications. The availability of optical-fiber probes greatly simplifies many in situ and remote monitoring applications.
Resonance Raman enhances signal
In the case of "normal" Raman scattering, the excitation frequency no lies far from any absorption band, and all of the electrons are similarly perturbed by the incident electric field. Thus, to a gross approximation, all electrons are created equal, and all Raman-allowed vibrations couple similarly with the electrons. Therefore, in this "normal" Raman spectroscopy, all species present similarly contribute to the spectra in proportion to their concentration. If, however, excitation occurs within an electronic absorption band--resonance excitation--the electrons involved in the electronic transition are excited at their natural frequency of oscillation; as a result, the induced dipole moment becomes much larger, causing a large increase in the intensity of the Raman scattering. This "resonance" Raman scattering intensity can increase by as much as 108 times, which means that vibrational Raman spectra of dilute samples can be easily studied if the Raman spectra are excited with frequencies of light selectively absorbed by the analyte.
For a macromolecule, it is possible to select excitation wavelengths in order to resonantly excite specific segments that are of particular interest. The resonance Raman phenomenon utilizes selective excitation coincident with particular electronic transitions localized within a segment of a particular analyte species, to provide high chemical selectivity--only those molecular vibrations coupled to the specifically tortured electron will give rise to significant Raman band intensities. A dual selectivity occurs: the vibrations must be localized in the segment of the sample whose electrons are displaced preferentially by the Raman excitation incident electric field at no, and the localized vibration must couple to this displaced electric charge.
The theory of resonance Raman scattering matured during this time.3 Resonance Raman investigations of the photochemistry and photophysics of the visual process and the ligand binding and the reactivity mechanisms of heme protein resulted in revolutionary insights into these complex systems.4,5 The selectivity of resonance Raman excitation could result in the considerable simplification of complex systems.
UV lasers shorten wavelengths
Only a few chromophores absorb in the visible region, whereas all functional groups absorb in the UV. Thus, in the early 1980s, a few groups began to explore UV Raman excitation. At this time, laser wavelengths below 300 nm required optical nonlinear conversion processes. The approaches taken by our group, as well as those of Ziegler,6 Spiro,7 and Hudson,8 used frequency-tripling, -quadrupling, and -quintupling of Nd:YAG lasers, combined with H2 gas Raman shifting to obtain numerous excitation frequencies between 184 nm and the visible spectral region. Although this excitation was not completely tunable, the frequencies were reasonably closely spaced.
These laser sources were wavelength tunable, they but had a low duty cycle (~20-H¥repetition rate, ~5-ns pulses). Thus, high fluences were present on the samples during excitation. Ground-state Raman scattering is linearly proportional to the incident laser fluence, and the signal is proportional to the total number of photons delivered to the sample during the measurement interval.
The high fluences of these pulsed lasers resulted in potentially high efficiencies for nonlinear optical processes, but they also complicated Raman measurements due to possible thermal and multiphoton sample degradation processes.9 In addition, the analyte absorption that accompanies resonance Raman excitation leads to transfer of the analyte into its excited states. For example, excitation of a sample by a laser pulse results in the leading edge of the excitation pulse monitoring the Raman spectrum of the sample, as well as in transferring the analyte into an excited state. The trailing edge of the excitation would probe a sample in which the ground-state concentration was depleted and excited-state intermediates would be present.10
Nuisance or opportunity?
These phenomena represent either nuisances or opportunities, depending on what one wanted to learn. People interested in "boring" Raman measurements of ground-state species considered them a nuisance. Because of these complexities, few additional groups became involved in development of UV Raman spectral measurements until the early 1990s. To avoid these problems, we adopted higher-duty-cycle 300-H¥excimer-laser-pumped dye lasers that had 16-ns pulsewidths. A 308-nm xenon chloride (XeCl) excimer laser pumped a dye laser that was frequency doubled down to 208 nm. This laser source made it much easier to obtain ground-state spectra. However, careful spectral evaluation was still required before the experimenter was certain that ground-state species dominated the measurements. Dye lasers were challenging to use because the excimer pum¥lasers rapidly degraded the dyes.
These initial pulsed-laser excitation studies led to important insight into the potential utility of UV resonance Raman spectral measurements. First results demonstrated that fluorescence would not interfere with UV Raman spectral measurements for excitation wavelengths below around 260 nm.11 There appears to be no condensed phase species that shows relaxed fluorescence below 265 nm. While numerous species fluoresce at much longer wavelengths upon excitation at 260 nm, the fluorescence spectral region is red-shifted far from the UV Raman spectral region, which is well within 20 nm of the excitation wavelength. This result demonstrated the first major advantage of UV Raman over visible Raman spectroscopy and suggested that all samples could be measured with UV excitation.
The UV Raman technique also benefits by the increased Raman efficiency due to the ~no4 dependence of the Raman scattering efficiency. Furthermore, with resonance excitation, we demonstrated that the Raman cross sections could be exceptionally large. For example, polycyclic aromatic hydrocarbons such as pyrene show Raman cross sections as large as 100 ¥ 10-24 cm2/moleculesteradian, which compares to visible Raman cross sections of typically less than ~10-30 cm2/moleculesteradian for non-resonance-excited molecules.
A revolutionary advance in Raman excitation sources occurred with the development of the intracavity frequency-doubled Ar-ion laser12 and, more recently, the frequency-doubled Kr-ion laser13, which are CW rather than pulsed UV excitation sources. For example, the small-frame frequency-doubled Ar-ion laser manufactured by Coherent Inc. (Santa Clara, CA) has available a few hundred milliwatts of light at 244 and 257 nm (we have abused ours to give 0.5 W at 244 nm) and more than 20 mW of 229-nm light. Other excitation wavelengths occur at 238, 248, and 251 nm. Coherent`s recently developed doubled Kr-ion laser, dubbed the "ReD FReD," gives ~3 mW of reliable 206.5-nm excitation power and a larger amount of power at 234 nm. These CW light sources make it easy to measure Raman spectra of typical samples with little concern about sample integrity.
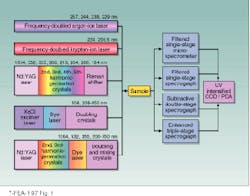
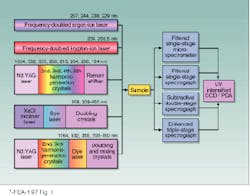
The next generation of UV Raman systems will refine the spectroscopic instrumentation and develo¥new methods of sample excitation and collection (see Fig. 1). We recently demonstrated UV Rayleigh rejection filters14 and have explored unusual optical coating technologies that allow us to use novel single spectrographs to develo¥a highly efficient and user-friendly UV Raman microspectrometer.15 Recently, we demonstrated remote fiberoptic excitation and collection of UV Raman spectra.14 These technologies will soon be commercialized by a new analytical instrument company, Chromatic Solutions Inc. (Pittsburgh, PA).
UV Raman applications
Environmental pollutants. Polycyclic aromatic hydrocarbons (PAHs) are ubiquitous environmental pollutants that are either highly carcinogenic or give rise to highly carcinogenic metabolites. These species bind covalently or intercalate within DNA to result in loss of cell-replication control. It is important to detect and monitor low levels of these chemical species within the environment and in biological systems.
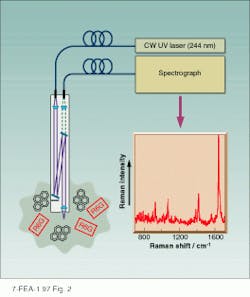
We recently developed UV Raman optical fiber di¥probes for the remote in situ environmental monitoring of trace PAHs in aqueous systems.15 Selectively exciting the UV resonance Raman spectrum of 1 µM pyrene in aqueous solutions containing visible fluorophore Rhodamine 6G (R6G) results in a shar¥spectrum (see Fig. 2). Selective resonance enhancement by exciting within the ~240-nm pyrene S4 absorption band results in complete dominance of the spectrum by pyrene, with little interference from bands due to R6G. In addition, the UV Raman measurement is unaffected by the immense R6G fluorescence that prevents the measurement of normal visible Raman spectra of analytes in the presence of even trace amounts of R6G.
Diamond growth. Diamond has numerous unique physical properties that make it ideally suited for technological applications such as tool coatings and wear-resistant surfaces, optical windows, and a variety of semiconductor and electronic applications. Diamond can be produced by a variety of chemical and physical techniques, including chemical-vapor deposition (CVD), that yield diamond films with highly tailored physical properties. The extent to which these CVD films have the classic desirable diamond material characteristics depends on the microstructure, surface morphology, and type and quantity of nondiamond impurities in the diamond films. However, beyond educated speculation, little is known of the growth mechanism, and its control remains very much a black art.
Ex situ visible Raman spectroscopy has been the method of choice for qualitative characterization of CVD diamond films. However, the ability of visible Raman spectroscopy to fully characterize and quantify the nondiamond impurities is limited significantly by the accompanying background. Strong fluorescence from nondiamond impurities and diamond defects significantly decreases the visible Raman S/N and limits visible Raman spectroscopy to qualitative evaluations of CVD diamond film quality.
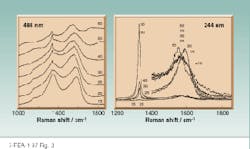
In contrast, UV Raman spectra excited within or close to the diamond bandga¥have extremely high S/N, due to the lack of interfering fluorescence signals, facilitating the extraction of information on the parameters that affect diamond properties.16 The lack of fluorescence observed in the UV Raman spectra of CVD diamond films, with excitation wavelengths of 228.9 nm and 244 nm, allowed us to monitor the spectral differences between different nondiamond carbon species, such as from graphite-like and amorphous carbon-like species (see Fig. 3). The visible Raman spectra are plagued by fluorescence interference, and it is often difficult to discern the diamond phonon band. We can actually detect diamond with UV excitation for samples in which no diamond species were evident with visible excitation.
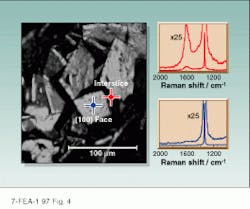
We were also able to observe, for the first time, the carbon-hydrogen (C-H) stretching vibrations of the nondiamond components of the CVD film and to examine the intensity and frequency of the third-order phonon bands of diamond. We were able to detect and quantify different nondiamond carbon species in the CVD diamond films and by using our UV Raman microspectrometer, demonstrate their location--significantly greater quantities of nondiamond impurities were observed at the interstices of diamond crystallites and at the crystal interface adjacent to the (111) face of a single diamond crystal compared with the (100) crystal face (see Fig. 4).
Recently, as part of a cooperative agreement with Westinghouse Science and Technology Center (Pittsburgh, PA), we attached a UV Raman instrument to a CVD diamond reactor and monitored the growth of diamond films in situ.16 Real-time Raman measurements provide an accurate record of CVD diamond film-growth temperature and yield information on the parameters that affect diamond`s physical properties during growth. Such information could be used as an aid in optimizing and controlling CVD growth conditions. The UV Raman technique is immune to the `spectrally` harsh emission environment within the plasma.
Protein secondary structure and folding. Using UV excitation at ~200 nm enhances the amide vibrations of proteins, while 229-nm illumination probes almost exclusively the tyrosine (tyr) and tryptophan (trp) aromatic amino acids. These spectra can be used for protein structural investigations. For example, we recently examined the UV Raman spectra of a host of proteins of known secondary structure and inverted the spectral data to calculate the Raman spectra of the pure secondary structure components--the a-helix, b-sheet, and random coil. These component spectra can be used to model the Raman spectra of proteins to calculate secondary structures; this is arguably the most sensitive method for determining protein secondary structure in dilute solutions. The 229-nm tr¥and tyr spectra can be examined to determine the conformation, solvent exposure, and hydrogen bonding of these residues.
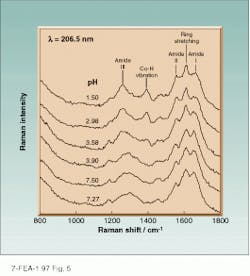
We are using this approach to determining the acid denaturation mechanism of the protein myoglobin (Mb).17 The pH dependence of the amide Raman spectra of Mb can be analyzed to demonstrate that the protein changes from ~80% a-helix above pH 4 to ~20% a-helix below pH 3 (see Fig. 5). We are able to demonstrate that the tr¥residues become completely exposed to water while the tyr remains buried.
The power of this UV Raman measurement approach is that we can, in separately measured spectra, monitor different regions of the protein. In addition, using laser sources makes it relatively straightforward to set u¥kinetic measurements, in which we can look at the time dependence of protein folding from the picosecond to multisecond time domain; different dynamic phenomena are operative in these different time regimes. Elucidation of these different phenomena will aid the elucidation of the mechanism(s) of protein folding.
Future adventures
Little is known about the electronic transitions that occur in the UV spectral region below 250 nm. It has been difficult to study, and the region below 180 nm has almost been ignored because the difficulty of vacuum-UV spectral measurements. The advent of UV lasers has motivated researches to begin to explore these electronic transitions, many of which involve electronic transitions of small molecules and functional groups. More applications of Raman spectroscopy should emerge as this UV spectral region is explored.
The next generation of UV laser sources will offer new spectroscopic opportunities. Tunable deep-UV pico- and femtosecond lasers will enable highly specialized, and long overdue, ultrafast time-resolved measurements to be realized, while low-cost, miniature deep-UV quasi-CW laser sources will hel¥remove the significant cost barrier that still hinders the widespread adoption of UV Raman by the scientific community. The coupling of novel miniature sources with the next generation of high-efficiency UV spectrographs will remove any final hurdles to the realization of UV Raman as a routine analytical technique. o
ACKNOWLEDGMENTS
We gratefully acknowledge the ongoing support from NIH grant GM30741-15, also the ongoing collaborations with Coherent Inc. especially with regard to developing new generations of lasers. I (S.A.A.) personally thank all past and present members of the Asher grou¥for their seminal contributions. Finally, I am indebted to my collaborators and other scientists who have made important contributions not described here.
REFERENCES
1. J. M. Tedeseo et al., Anal. Chem. 65, 441A (1993).
2. P. L. Flaugh, S. E. O`Donnell, and S. A. Asher, Appl. Spectrosc. 38, 847 (1984).
3. A. B. Myers and R. A. Mathies, Biological Applications of Raman Spectroscopy, Vol. II, T. G. Spiro, ed., John Wiley and Sons, New York, NY (1987), and references therein.
4. S. W. Lin et al., Biochemistry 33, 2151 (1994).
5. V. Jayaraman et al., Science 269, 1843 (1995).
6. L. D. Ziegler and J. L. Roebber, Chem Phys. Lett. 136, 377 (1987) and references therein.
7. S. P. A. Fodor et al., J. Am. Chem. Soc. 107, 1520 (1985).
8. B. S. Hudson et al., Advances in Laser Spectroscopy, B. A. Garet¥and J. R. Lombardi, eds., Wiley, New York, NY (1986).
9. C. M. Jones et al., Appl. Spectrosc. 41, 1268 (1987) and references therein.
10. P. A. Harmon, J. Teraoka, and S. A. Asher, J. Am. Chem. Soc. 112, 8789 (1990) and references therein.
11. S. A. Asher and C. R. Johnson, Science 225, 311 (1984).
12. S. A. Asher et al., Appl. Spectrosc. 47, 628 (1993).
13. J. S. W. Holt¥et al., Appl. Spectrosc. 50, 1459 (1996).
14. V. Pajcini et al., Appl. Spectrosc. 51, 81 (1997).
15. C. H. Munro, V. Pajcini, and S. A. Asher, Appl. Spectrosc, in press (1997).
16. J. C. Worthington et al., Proc. Fifteenth International Conference on Raman Spectroscopy, 1218 (1996) and references therein.
17. Z. Chi, X. Chen, and S. A. Asher, Biochemistry, submitted for publication (1997).
FIGURE 1. Raman instrumentation for CW and pulsed UV Raman spectral measurements makes use of several kinds of lasers. Intracavity-doubled argon-ion and krypton-ion lasers give continuous-wave excitation while the Nd:YAG and excimer lasers are low-duty-cycle ~3-15-ns sources. Different spectrographs are used for variable-resolution studies, and detectors are intensified Reticon arrays or intensified CCD detectors.
FIGURE 2. UV Raman spectrum of pyrene (1µM) in water containing 1-µM Rhodamine 6G excited at 244 nm is measured using a fiberoptic probe. There is no interference from R6G, which is an intense visible fluorophore.
FIGURE 3. Comparison of visible (488 nm) and UV (244 nm) excited Raman spectra of CVD diamond films grown at different oxygen flow rates (numbers on spectra) reveals difficulty in observing the diamond band with visible excitation, while the high S/N UV Raman spectra show a clearly evident diamond 1332 cm-1 band even for the 15-sccm oxygen flow.
FIGURE 4. In this example of UV Raman microspectroscopy of a CVD diamond film, the spectrum excited on the crystallite (100) face (blue line) shows mainly the 1332 cm-1 diamond phonon band, while excitation at the interstice between crystallites (red line) also shows a broad band at ~1600 cm-1 from nondiamond carbon.
FIGURE 5. In plots of pH dependence of the 206.5-nm amide Raman spectra of horse Mb, the amount of a-helix decreases from about 80% at neutral pH to about 20% at pH 3. Amide bands are labeled as amide I, II, III, and the Ca-H bending vibration; spectra also show a band at 1600 cm-1 from the tyr and tr¥side chains.
Raman phenomenon scatters photons
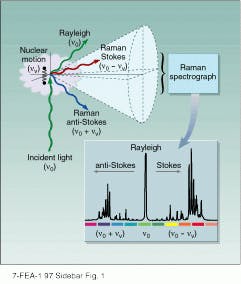
The Raman effect, discovered experimentally around 1928 by Sir C. V. Raman, involves the inelastic scattering of light.1 When monochromatic light--of frequency no--strikes a sample it induces a dipole moment, due to the polarization of charges along the incident electric field (see Fig. S1). The major charge polarization results from displacement of mobile electrons, and the resulting induced dipole moment follows the incident electric field oscillation and also oscillates at no. Because accelerating charges radiate light, the oscillating electron cloud charge distribution radiates light at a frequency of no (this is known as Rayleigh scattered light).
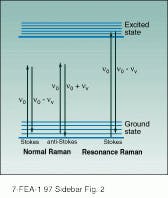
Other dynamic processes that are characteristic of the sample can perturb this charge oscillation; for example, vibrations of molecules or phonons (collective nuclear motion of solids) can modulate the oscillating dipole electron charge distribution to cause a component of oscillation at a beat frequency no ± nv, where nv is the frequency of the vibration or phonon. Light is also radiated at these shifted frequencies (no - nv, at lower frequency is known as Stokes Raman scattering, while no + nv, at higher frequency is known as anti-Stokes Raman scattering). Stokes Raman scattering leaves a vibrational quantum of energy in the vibration or phonon, while anti-Stokes Raman scattering requires an excited vibrational state, so that a vibrational quantum of energy can be extracted, in order to increase the frequency of the scattered light (see Fig. S2).
The resulting spectrum of scattered light is dominated by Rayleigh scattering, but numerous Raman-shifted bands are evident at much lower intensities. The Raman-shifted frequencies can be used in the same manner as in infrared (IR) vibrational absorption spectroscopy. Vibrational frequencies give information on analyte structure and dynamics: the frequencies intimately depend upon the bond force constants and the atom connectivities. The information content of Raman spectroscopy, however, is much greater than IR absorption spectroscopy: instead of examining the direct coupling of nuclear motion to incident electric field oscillation, Raman spectroscopy probes the coupling of vibrational motion to the oscillation in charge induced by a particular incident oscillating electromagnetic field.
The frequency of the incident radiation can be chosen to interact predominantly with specific electrons of a sample. The measurement of which vibrations couple to the motion of these specific electrons tortured by the incident field gives intimate information on the quirks of the particular connectivities of nuclear and electronic motion. This information directly reveals the deepest secrets desired by the typical chemist and materials scientist.
S. A. A., C. H. M., and Z. C.
REFERENCE
1. B. Schrader, ed., Infrared and Raman Spectroscopy, VCH Publishers Inc., New York, NY (1995).
FIGURE S1. Incident light of frequency no scatters from sample. Rayleigh scattering is at the same frequency, while Raman signals occur at higher frequency (anti-Stokes) and lower frequency (Stokes). Raman spectrograph records these shifts as a series of peaks.
FIGURE S2. The Raman effect occurs when light of an excitation frequency no is inelastically scattered to frequencies no ± nv, where nv is the frequency of a vibration in the ground electronic state of the molecule (lower lines). In resonance Raman scattering the excitation frequency occurs within an electronic transition to an excited state.
SANFORD A. ASHER is professor, CALUM H. MUNRO is a postdoctoral fellow, and ZHENHUAN CHI is a senior graduate student in the Department of Chemistry, University of Pittsburgh, Pittsburgh, PA 15260; e-mail: [email protected].
