Image processing advances display metrology
GARY PEDEVILLE
Production defect inspection of most display types—from automotive and avionics displays, to televisions, flat-panel displays, and projection systems—traditionally has been performed visually by human inspectors. This has started to change in recent years as an increasing number of automated inspection systems based on advanced image-processing algorithms are deployed throughout the world. These new automated display inspection systems provide advantages in terms of economics, objectivity, and repeatability. In some cases, these systems are even capable of correcting display nonuniformities by uploading mathematical corrections to the display electronics.
Calibrated imaging systems
Displays present information or images to a human viewer so the goal of any automated display-metrology system must be to identify defects that would be bothersome to the human eye. Accomplishing this goal places specific requirements on both system hardware and software.
In terms of hardware, an imaging system must respond to color in a way that is analogous to the human visual system. Typically, this requires the use of one or more scientific-grade, thermoelectrically cooled CCD cameras, and color filters designed to match the CIE spectral responsivity curves. The use of the CIE color space produces a good match with human vision. Cooling of the CCD ensures system stability and minimizes image noise. These elements are essential for establishing and maintaining this correlation.
Other important factors in the imaging system are spatial resolution and dynamic range. Shannon sampling theory, as applied to image processing, states that the camera must image the smallest defect of concern onto four CCD pixels to identify it accurately. However, this isn’t an absolute rule. More spatial resolution is required to determine the exact luminance or precise location (to within a small fraction of a display pixel) of the defect. On the other hand, lower spatial resolution might be adequate, depending on the image-processing algorithm used and the contrast ratio of the defect compared to the neighboring display-area brightness or color.
Resolution of the CCD also depends on the sensor fill factor. This is the percentage of the CCD surface that detects light. For most scientific-grade CCDs, the fill factor is very near 100%, but for interline-type progressive-scan CCDs, the fill factor can be only 50%. In the latter case, it’s quite possible that a small defect will be missed because it is not imaged on to the active area of the CCD.
The contrast threshold that defines a defect also affects the required resolution. A high-contrast defect, say something that has a 1:1000 luminance ratio between defect and surrounding area, might be easily detectable with low-spatial-resolution data and the correct image-processing algorithm. Detecting a 1% luminance difference, however, would require much higher spatial resolution and a different image-processing algorithm. At all times, the most important system performance metric is the required signal-to-noise ratio for the image-processing algorithm to make an unambiguous identification.
Dynamic range is important for measuring high-contrast ratios in a single image accurately, and for accurate color measurement. In well-designed CCD imaging systems, the final limit on sensor dynamic range is determined by shot noise, which is set by the full well capacity of the CCD pixels. The full-well capacity is related directly to pixel size. Therefore, large-pixel CCDs, with a higher full-well capacity, can deliver better dynamic range than small-pixel CCDs. This reason again favors scientific CCDs over progressive-scan CCDs.
Image-processing algorithms
Given hardware that “sees” in a manner analogous to the human visual system, the next challenge is to create software that can process the raw image data and identify problems that would be troublesome to a human viewer. The specifics of this task vary by display technology and application. In some cases, the quality metrics are well defined and successful solutions have already been implemented in production. For some display types, automated metrology remains an active area of pursuit.
For many display technologies, one of the most important items of concern is the identification of mura defects. The term “mura defect” is routinely used in the display industry to describe undesired nonuniformities in terms of both color and brightness. Most algorithms under development for this purpose fall into two categories: defect segmentation and classification methods, and statistical methods.
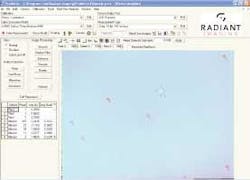
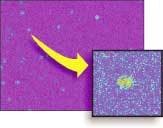
In segmentation, the image is divided up into its constituent objects, namely defects and background (see Fig. 1). Then, each defect is sorted into several predetermined classifications, such as pixel defects, blobs, spots, patterns, and lines. Finally, an algorithm specific to each defect class is applied to determine the severity of that defect.
This approach works well when all types of defects of concern are well defined in advance, and the defects can be clearly separated from the display background. Examples of this are dead pixels or dead columns in a display. However, the segmentation and classification approach becomes problematic when faced with a broad range of defects that may not fit neatly into predefined types (see Fig. 2). In this case, implementation requires a high level of expertise and extensive application-specific software customization, which is necessary to reliably place each defect for the particular display type in the proper classification to ensure that it will be ultimately evaluated by the correct algorithm. The complexity is such that the customization is generally beyond the expertise of a manufacturer’s production engineers and requires partnering with application engineers having display, radiometry, and color-science training who can use expert knowledge to implement the algorithms to yield the desired results.Even then, it is still possible to confuse a system, such as when multiple defects overlap. A display might contain a line defect intersecting a blob defect, for example, or a luminance defect occurring simultaneously with a color defect, or a spot defect contained within a repetitive pattern defect. Because it is impossible to test every conceivable defect case, this makes it difficult to ensure complete system robustness when faced with the diversity of problems experienced in real-world displays.
Despite these drawbacks, some organizations have developed standards based on this approach. For example, SEMI (San Jose, CA) has defined the quantity Semu (SEMI Mura), which is a formula for evaluating luminance—only defect severity that implies the use of a segmentation and classification algorithm.
In contrast to the segmentation approach, statistical methods do not attempt to identify individual defects. Some statistical methods work by comparing various measurements on the display under test to measurements taken from what is considered to be a “good” display. Various statistical calculations are then performed to determine how far the test unit departs from this “gold standard.”
A wide range of image-processing and analysis algorithms can be used in this context. The luminance and chromaticity coordinate of every point in the display can be measured, for instance. The standard deviation of the distribution of this data can then be compared with the gold standard. It’s possible to limit the measurement process to features of a given size range by first converting spatial variations in color or luminance into a power spectrum in the frequency domain. A high- or low-pass filter then eliminates data at unwanted spatial frequencies. The resulting frequency spectrum can then be converted back into an image and compared statistically to the data for the gold-standard display (see Fig. 3).There are numerous other effective local and global algorithms for providing metrics for statistical comparison between the display under inspection and a gold standard. The Sobel mask technique, for example, compares a subregion of a display to neighboring regions, and the extent of variations in these comparisons over the face of the display is gauged against the standard. Other algorithms include 2-D gradient transformations, histogram equalization, color-luminance difference, gamma transforms, and so on. The particular method chosen depends on the needs of the specific application.
The main advantage of statistical comparison methods is that they don’t require advance knowledge of all possible defect types, and the validity of results doesn’t depend upon the ability to identify, isolate, and classify each particular defect. They actually perform in a way more analogous to human visual inspectors comparing a sample under inspection to a control sample.
Statistical analysis relies on a mathematical methodology that is well established in many other applications, from statistical process control (SPC) to design of experiments (DOE). These methods have been proven robust, much easier to apply than approaches requiring a priori knowledge of defect types, and extremely cost-effective in industrial practice.
Both the statistical and segmentation techniques are in use in a wide variety of display production environments.
The difficult LCD
Unfortunately, one of the most commercially important display types, liquid-crystal displays (LCDs), still presents challenges for automated metrology. Unlike cathode-ray tubes, organic light-emitting diodes, and plasma display panels, LCDs exhibit a high level of angular dependence so some defects may only be viewable from a certain angle. This has been addressed in R&D metrology systems by moving the imaging system to view the display from many different view angles, but this approach can take minutes to collect thousands of images of a single display—too slow for many production applications. Ultimately, the results from these imaging flat-panel measurement systems in R&D environments will likely lead to the design of robust, multiple-camera systems for automated production inspection of large-screen LCDs.
Other difficulties with LCD panels are derived from their construction, which consists of a sandwich of many individual components, including a backlight, diffusers, liquid-crystal panel, color filters, polarizers, and a brightness-enhancement film. The result is that a wide variety of defect types can occur, both in individual components, as well as arising from misalignment of various components. The diverse nature of LCD defects, in terms of size, shape, and contrast, makes comprehensive segmentation and classification difficult, and statistical methods for this technology seem preferable.
While there have been many successes in deploying automated metrology systems for display defect detection, there is still no single, definitive approach for all applications. Even within a specific display technology, various manufacturers and end users can have different expectations and definitions of what constitutes quality. Ultimately, implementing an effective production metrology solution requires partnering with a system developer who thoroughly understands how to successfully apply image-processing techniques to properly correlate with human vision.
Gary Pedeville is a senior optical and software development engineer at Radiant Imaging, 15321 Main St. NE, Suite 310, P.O. Box 5000, Duvall, WA, 98019; e-mail: [email protected].


