Analytical spectroscopy benefits from telecom photonics
Miniature near-IR spectrometers based on telecommunications-grade optical channel monitors are well suited for process analytical instruments.
A telecommunications optical channel monitor (OCM) is a highly specialized and optimized near-IR spectrometer that produces a chart of power versus wavelength. In dense wavelength-division multiplexing, a resolution of 3 GHz (approximately 25 pm or 0.1 cm−1, in more familiar spectroscopy units) is required, with stable unattended performance for a rated 25-year lifetime, and conformance to tough telecommunications (Telcordia) qualification standards. These exacting requirements have now been translated to analytical near-IR spectroscopy, and in particular to process applications.
Miniature package
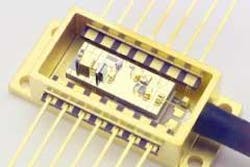
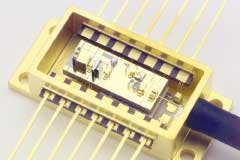
All optical components for an OCM are contained in a single 14-pin butterfly package (see Fig. 1). Light from an optical-communications fiber is passed into the module via a segment of single-mode fiber and then through a MEMS-based Fabry-Perot tunable filter onto a small-area indium gallium arsenide (InGaAs) detector. Radiation from a superluminescent light-emitting diode directed through an etalon is combined with this beam, generating a spectral fringe pattern used for wavelength referencing. Finally, the use of high-reflectivity (approximately 99.9%) mirrors gives high finesse (on the order of 3000) in the Fabry-Perot filter, and therefore the high spectral resolution required. A signal-to-noise ratio of 30 dB is routinely achieved under these conditions.
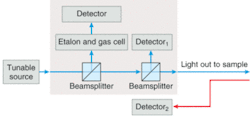
Traditional laboratory and process near-IR spectrometers used for analytical chemistry rely on tungsten-halogen light bulbs as their broadband source. Connecting a bulb to an OCM, however, does not yield a useful device-it is simply not feasible to couple enough light from a large incoherent source into the optical fibers and optical components used. Instead, an OCM contains a tunable light source, with the radiation directed through a sample and onto a detector to form a complete spectrometer. In this configuration, real-time wavelength and source referencing are achieved in a second module, termed a wavelength-and-amplitude-reference module (see Fig. 2). Every point of every scan is referenced, resulting in unparalleled long-term stability.
Semiconductor light sources are commercially available from several vendors in the traditional telecommunications region of the spectrum. These sources can also be fabricated for use at longer wavelengths into the information-rich “combination band” area of the near-IR spectrum.1 They typically have useful spectral coverage of 100 to 250 nm, and although one device can cover only a portion of the traditional near-IR range of 1.0 to 2.5 µm, this is not a disadvantage. First, they can be combined to cover a larger range, either continuous or discontinuous. Second, it is the nature of near-IR spectroscopy that molecular information is essentially repeated several times in this region through first, second, and third overtones. Therefore, using these semiconductor light sources permits a new approach: targeted region analyses, in which the spectrometer is tailored to the task at hand. As an example, the first overtone of carbon-hydrogen stretching modes lies between 1600 and 1800 nm, and therefore all organic materials will absorb in this region; the second overtone region is around 1150 to 1250 nm, and the third around 850 to 950 nm.
Fabry-Perot has high resonant frequency
The MEMS tunable Fabry-Perot filter consists of two mirrors, either plane or curved, facing each other and separated by a small distance. When a Fabry-Perot cavity is at its resonance, constructive interference within the cavity allows transmission of essentially 100% of the light through the filter; when off resonance, it reflects nearly all the incident light. Changing the mirror separation by applying voltage to the MEMS structure tunes the transmitted wavelength of a Fabry-Perot interferometer. Because of the extremely small size and low mass of the movable mirror, the mechanical resonant frequency of the filter is higher than 100 kHz, and the filter can be scanned over its entire range in less than 50 µs at a resolution as high as 0.1 cm−1. One unique feature of this filter design is the separation of the optical and electrical functions, allowing the user to easily tailor its optical parameters (free spectral range, finesse, and bandwidth) without affecting the electrical actuation. The reflectivity and the spacing between the mirrors can be varied to allow the bandwidth and scanning range to cover the entire near-IR range from 1 to 2.5 µm and beyond.
The supporting element onto which all the optical elements are mounted must not only be mechanically rigid, but must also provide for effective heat transfer. This combination of material requirements for high modulus and high thermal conductivity generally represents a serious disadvantage for silicon wafer-based optical-bench designs. High-conductivity ceramics, such as aluminum nitride, provide an advantage, especially in applications that include high-power sources or high-speed electronics that often dissipate more than a watt of heat. The optical components are affixed to this bench using a gold-tin solder. The optical bench sits atop a thermoelectric cooler, which stabilizes its temperature to ±0.1°C so that the spectrometer will not drift as the ambient temperature changes.
Combining the properties of all the components, these miniature spectrometers are capable of measuring high-resolution spectra, at high signal-to-noise ratio, in a short measurement time.
Pharmaceutical applications
Conventional near-IR spectrometers are widely used for a large variety of qualitative and quantitative analyses, including those performed at-line and on-line.2, 3 In particular, the U.S. Food and Drug Administration Center for Drug Evaluation and Research is sponsoring a process-analytical-technology initiative in the pharmaceutical industry to apply new technologies for improving manufacturing efficiency.4 The ultimate goal is to enable pharmaceutical manufacturers to reduce their costs and provide consumers with greater assurance that they are receiving high-quality drugs.
Previously, traditional instruments were based on laboratory spectrometers, and were of a variety of configurations: scanning dispersive, Fourier transform, acousto-optic tunable filter, and grating/diode array. While all of these have particular advantages, none combine the ideal characteristics of a process instrument. Their limitations include temperature sensitivity, vibration sensitivity, limited sensitivity beyond 1.7‑µm, large physical size, the limited lifetime of the tungsten halogen source, and problematic calibration transfer between spectrometers.
Spectrometers based on OCMs do not have these problems. Integrating a thermostat into the low-mass optical bench of an OCM allows stable operation over a wide range of ambient temperatures; the extreme small size and low mass of the optical components places the resonant vibrational frequency in the 100-KHz range, far above common excitation sources; the whole instrument is contained in a 6 × 4 × 2-in. package and can be made intrinsically safe; the use of a semiconductor light source, in combination with a single, rather than array, detector allows high signal-to-noise operation at longer than 1.7‑µm, which has traditionally limited the operation of grating/diode array systems; and semiconductor sources are rated for a 25-year lifetime and the manufacturing process ensures that the spectrometers are essentially identical. Therefore, emerging spectroscopic technologies can allow a manufacturer to monitor and analyze all the components of a product (active and inactive ingredients, moisture, and so on) at all stages of the process, and applies to inbound logistics, active-ingredient manufacture, bulk formulation, fill and finish, packaging, and outbound logistics, as well as stability testing.
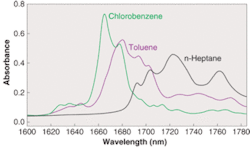
An example shows the efficacy of using a targeted range and the ability to transfer a quantitative calibration between spectrometers. Twenty standards of a three-component mixture containing chlorobenzene, toluene, and n-heptane with differing compositions were prepared gravimetrically.5 The concentrations ranged from 20% to 75% chlorobenzene, 21% to 77% toluene, and 2% to 11% n-heptane; the spectra were run on three different Axsun spectrometers over the 1600- to 1785-nm range at a 2-nm resolution using a conventional slide-mount transmission cell with quartz windows. Light was delivered to the cell via a single-mode fiber and a 5.5-mm-diameter collimator, and returned to the detector via a second collimator and a 600-µm-diameter multimode fiber to a lensed 300-µm-diameter InGaAs detector, with each data collection taking seven seconds (see Fig. 3).
A quantitative analysis was then performed using these data as the training set, and partial-least-squares methodology. The spectra were then rerun both on the same spectrometer and on two additional spectrometers. The standard error of prediction was then computed for each set, and found to be 0.2% and identical, within random error, for each spectrometer. This shows that a calibration can be created on one spectrometer and deployed on many, which is a critical factor in process analysis.
REFERENCES
1. C. E. Miller, “Chemical Principles of Near-Infrared Technology,” Chapter 2 in Near Infrared Technology in the Agricultural and Food Industries, Phil Williams and Karl Norris, Eds., American Association of Cereal Chemists, St. Paul, Second Edition (2001).
2. J. M. Chalmers, Ed., Spectroscopy in Process Analysis, CRC Press, Boca Raton (2000).
3. C. Henry, Analytical Chemistry 71, 625A (1999).
4. United States Food and Drug Administration, Center for Drug Evaluation and Research, www.fda.gov/cder.
5. C. M. Wehlburg, D. M. Haaland, and D. K. Melgaard, Applied Spectroscopy 56, 877 (2002).


