FT-IR spectrometers profile optoelectronic emitters
FT-IR spectrometers profile optoelectronic emitters
Rick Hapanowicz
Research is underway to develop new and compact solid-state sources with emission in the mid-infrared spectral region. Potential applications of a reliable and compact device with mid-infrared spectral characteristics include remote sensing, molecular spectroscopy, and communications. Fourier transform infrared (FT-IR) spectrometers are useful tools for researchers characterizing these mid-infrared emission devices.
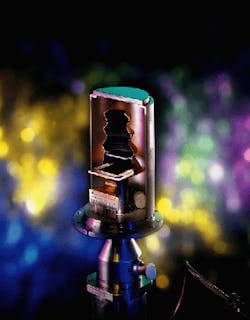
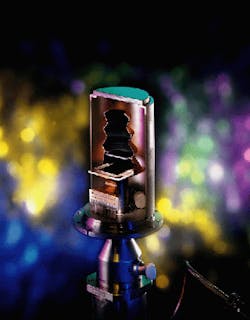
Mid-infrared radiation can be generated from semiconductor devices using pulsed electrical excitation (electroluminescence) or pulsed optical excitation (photoluminescence). The mid-infrared spectral output of semiconductor and quantum-cascade lasers or light-emitting diodes (LEDs) can be characterized using linear scanning and step-scanning spectroscopy techniques on a dynamically aligned FT-IR spectrometer controlled by a digital signal processor (DSP; see photo above and on cover).
Linear-scanning FT-IR spectroscopy
Mid-infrared measurements are typically performed using a linear scan interferometer and an appropriate transmission, reflection, or emission accessory to guide the light to and from the sample of interest. The constant linear scan velocity of the mirror permits the rapid collection of a large number of scans for spectral coaddition. The infrared radiation from the experimental source is modulated at its own characteristic Fourier frequency.
The Fourier frequency is the product of the optical mirror velocity and the wavenumber of the radiation of interest. Fourier frequencies range from 8000 to 50 Hz for the majority of commercial linear scanning spectrometers operating in the mid-infrared spectral region. The Fourier transform process and electronic filtering in this frequency regime eliminate the low-frequency noise (1/f) from the spectral measurement. For continuous-wave devices, the emission output can be optically guided into the emission port of the spectrometer and directly measured using the linear-scanning operation of the FT-IR spectrometer.
When measurements on modulated devices are desired, care must be taken to have the device modulation frequency outside the range of the Fourier frequencies of the spectrom eter. The device frequency should be at least ten times greater than the highest frequency in the Fourier spectrum. The factor-of-ten difference allows use of a phase-sensitive detection scheme, such as a lock-in amplifier, to demodulate the device modulation. Alternatively, an electronic low-pass filter can be used to reject the high-modulation-frequency information. The requirement to maintain this difference restricts the range of electrical or optical modulation frequencies that can be used to produce emission output, which in turn limits the optoelectronic devices that can be measured by this method.
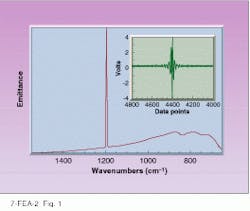
Modulated semiconductor diode lasers are an example of devices that can be characterized in the mid-infrared region.1-3 To obtain the spectrum seen in Fig. 1, a modulated semiconductor diode laser was mounted in a helium cryostat and was electrically biased using 20-ns pulses with a duty cycle of 1:1000 (50-kHz modulation). Spectral output occurs in a 14 ¥ 200-µm channel on the device, and the power of the emitted radiation is on the order of 1 mW.
This device assembly was positioned at a focus point and imaged into the emission optics of a Magna 850 spectrometer (Nicolet Instruments, Madison, WI) using zinc selenide (ZnSe) optics. The emission of the laser is modulated by the linear scanning of the spectrometer interferometer and imaged onto an internal mercury cadmium telluride (Hg1-xCdxTe) de tector. The internal detector signal was low-pass filtered (20-kHz) using the onboard spectrometer electronics to keep the device modulation frequency from folding into the measured spectral region during the Fourier-transform process.
The band at 1200 cm-1 is the emission output from the mid-infrared diode laser. The inset in Fig. 1 illustrates the interferogram measured in this experiment. A sine wave is evident in the wings of the interferogram. The Fourier transform of a sine wave in the frequency domain transforms to a line spectrum in the wavenumber domain (the emission of the laser device). Superimposed upon the laser emission spectrum is a blackbody curve of the room-temperature background. Because the output power of the laser is high (much higher than the room-temperature background), there is no need to use a phase-sensitive detection scheme to reject the background information from the spectrum. That information can be eliminated from the spectrum by performing a linear-scan measurement with the laser off and subsequently subtracting this spectrum from the device spectrum.
The blackbody background contribution can be eliminated from the emission spectrum if a double-modulation linear-scanning measurement is performed. The detector signal is first demodulated by a lock-in amplifier synchronized to the frequency of the emission device. This process produces an interferogram that contains spectral information only at the device operation frequency. The second demodulation occurs as a result of the Fourier transform process.
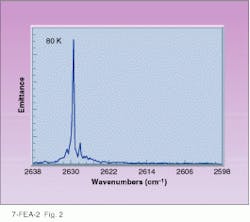
Researchers at Sandia National Laboratories (Albuquerque, NM) have measured the mid-infrared spectral output from a modulated indium arsenic antimonide (InAsSb) diode laser using a double-modulation technique.4 The laser was electrically biased with 100-ns pulses at a duty cycle of 1:1000 (10-kHz modulation). The spectrometer was operated at an optical velocity of 0.0475 cm/sec (mid-infrared Fourier frequency range: 190-19 Hz). The spectrum provides information on the device output without any interfering background radiation that might distort the emission spectrum (see Fig. 2).
Step-scanning FT-IR spectroscopy
Linear-scanning FTIR spectroscopy is a useful technique for characterizing emitters when the emission output is of mid- to high power and the modulation of the excitation is outside the Fourier spectrum frequency domain. When the power of the emission signal is very small or a very low duty cycle is used in the excitation process, then step-scanning, another interferometric measurement technique, can be used to measure the emission response.
The moving mirror in a linear-scanning spectrometer is set to a constant optical velocity, producing an interferogram that is signal-averaged with each scan. A step-scanning spectrometer has the ability to completely stop the moving mirror at equally spaced positions (retardation points) in the interferometer. Because there is no motion of the mirror at the retardation points, Fourier frequencies are eliminated and do not contribute to the measurement. This method of making device characterization measurements uses amplitude-modulation step-scan techniques (phase modulation step-scan techniques are also possible but are outside the scope of this article5-7).
Spectrometers are available that allow a researcher to select via software either the linear-scan or step-scan mode of operation. Digital-signal-processor-controlled spectrometers have sophisticated servo-controlled mechanisms that provide position accuracy at each retardation point of better than ۫ nm. Additionally, the DSP provides dynamic alignment of the phase fronts of the interferometer mirrors between each retardation position.
A primary benefit of step-scan spectroscopy over linear-scan spectroscopy is that the entire spectral range is modulated at a single frequency. A modulated electrical or optical excitation can be applied to a device at the desired frequency without concern for frequency separation between the device and Fourier frequencies. The device modulation frequency can range from a few hertz to tens of thousands of hertz.
Modulation of the emission radiation permits the use of phase-sensitive detection schemes that can greatly improve the ability to measure weak signals in surrounding background radiation. Lock-in or boxcar amplifiers provide the ability to demodulate the detector signal using the device modulation frequency as a reference signal. A sufficient time delay at each retardation, before the digitization event, can be adjusted to accommodate for the time constant of these electronics. The digitizer of the spectrometer samples the demodulated output at each retardation point in the scan to produce an interferogram that contains spectral information only at the modulation frequency.
LED spectral measurements
The ease of using step-scan spectroscopy to measure modulated and low-power-output devices makes it suitable in the characterization of LEDs with mid-infrared output. Narrow-band mid-infrared electroluminescence can be produced in II-VI and III-V semiconductors doped with rare-earth atoms. These devices are incoherent sources and have power output levels in the nanowatt range.
The linear-scanning method can be used to characterize laser devices (coherent sources with power outputs in the milliwatt range), but low-power-output LED characterization requires the step-scan technique. The spectral information from the device would be hidden beneath the background blackbody spectral information if a linear-scanning technique was used. In modulating the device, step-scanning and phase-sensitive detection can be used to detect the signal in the presence of the surrounding background information. Experiment parameters such as the duty cycle and the input power to the device need to be optimized to eliminate self-heating effects that can change the ultimate spectral output. Even with low duty cycles and low power output, step-scanning FT-IR can produce quality mid-infrared electroluminescence spectra of LEDs.
In experiments at Bell Lab oratories, Lucent Technologies (Murray Hill, NJ), an LED was mounted in a helium cryostat and was electrically biased using 50-ns pulses with a duty cycle of 1:400 (50-kHz modulation). This device assembly was positioned at a focus point of the emission optics of the spectrometer, directed through the interferometer and imaged onto an external indium antimonide (InSb) detector.
The detector output was directed into the input of a lock-in amplifier, and the 50-kHz signal from the electrical pulse generator was connected to the reference input of the lock-in amplifier. The demodulated output of the lock-in amplifier was directed to the input of the internal 100-kHz digitizer of the spectrometer. The time constant, sensitivity, and phase of the lock-in amplifier were adjusted to maximize the demodulated signal. Parameters important for the step-scan data collection (such as resolution, apodization, and signal-averaging time) were adjusted using the spectrometer control software.
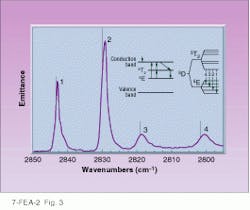
Figure 3 illustrates a 0.5 cm-1 resolution electroluminescence spectrum from a iron-doped indium gallium arsenic phosphide (Fe:InGaAsP) LED.8,9 The spectral output occurs in a 40 ¥ 150-µm channel on the device, and the emission power is on the order of 10 nW. Band assignments were attributed to intracenter transitions within the 5D states of the Fe2+ ions substituted for indium. The vertical lines on Fig. 3 indicate the band positions for the binary composition, InP. The shift to a lower frequency indicates that the field strength of the Fe2+ ions is reduced in the quaternary composition. A shoulder can also be observed on the band at 2843 cm-1 attributed to isotopic shift (54Fe/56Fe). The advantage of step-scanning spectroscopy measurements on miniature and low-power-output modulated devices is evident in the quality of the measured, high-resolution spectrum.
Eyeing the beam
In addition to measuring laser action or electroluminescence emission, a FT-IR spectrometer can also measure photoluminescence or magnetophotoluminescence events10,11 or perform differential absorption spectroscopy.12 The experimental configuration for photoluminescence is similar to that for electroluminescence except that the sample emission is produced using optical excitation. Differential absorption spectroscopy is useful for the measurement of intersubband lifetimes in semiconductors. In this experiment, a pump laser excites electrons to a first excited state and the FT-spectrometer probe beam measures the differential transmission from the first excited state to the second excited state in the band. Clever experiments can be devised that use linear-scan and step-scan spectroscopy to measure electronic transitions in semiconductor devices. Fourier-transform spectrometers can also be configured to perform emission measurements in the visible, near-infrared, and far-infrared spectral regions in both linear-scan and step-scan modes of operation.
The nature of the optoelectronic device under investigation plays a major role in the determination of what mid-infrared interferometric scanning technique is chosen for optical characterization. Linear-scanning spectroscopy is a method of choice when the device under investigation has a high output power and is modulated in a frequency range above the highest Fourier frequency of the spectrometer. The spectral output of emission devices that have low power outputs or require low duty cycles or modulation frequencies for operation should be characterized using step-scanning spectroscopy. In either mode, an FT-IR spectrometer is a powerful tool for optoelectronic researchers. o
ACKNOWLEDGMENTS
The author would like to thank Nino Scamarcio and Jerome Faist at Lucent Technologies, Bell Laboratories (Murray Hill, NJ), and Steve Kurtz at Sandia National Laboratories (Albuquerque, NM) for the helpful discussions and example spectra.
REFERENCES
1. J. Faist et al., Science 264, 553 (1994).
2. J. Faist et al., Appl. Phys. Lett. 65(1), 94 (1994).
3. J. Faist et al., Phys. Lett. 64(7), 872 (1993).
4. S. R. Kurtz et al., Appl. Phys. Lett. 64(7), 812 (1994).
5. R. A. Palmer, Spectroscopy 8(2), 26 (1993).
6. R. A. Palmer et al., Appl. Spec. 47(9), 1297 (1993).
7. V. G. Gregoriou et al., Appl. Spec. 47(9), 1311 (1993).
8. G. Scamarcio et al., J. Nonlinear Optical Physics and Materials 5(1), 25 (1996).
9. G. Scamarcio et al., Appl. Phys. Lett. 68(10), 1374 (1996).
10. S. R. Kurtz and R. M. Biefeld, Appl. Phys. Lett. 66(3), 364 (1995).
11. S. R. Kurtz and R. M. Biefeld, Phys. Rev. B 44(3), 1143 (1991).
12. J. Faist et al., Appl. Phys. Lett. 63(10), 1354 (1993).
Nino Scamarcio adjusts
cryostat containing
Fe:InGaAsP LED before
performing step-scan
Fourier-transform infrared
spectroscopy experiment
to characterize the device`s spectral output. Magna 850 FT-IR spectrometer is in foreground.
FIGURE 1. Output from quantum cascade laser passes into the emission optics of a Nicolet Magna 850 spectrometer (operating in linear-scan mode) to produce this spectrum. Interferogram (inset) illustrates a sine wave in frequency space from the sharp emission, characteristic of laser output.
FIGURE 2. Double-modulation technique eliminates background contribution in this mid-infrared emission spectrum of an InAsSb diode laser.
FIGURE 3. Step-scan electroluminescence spectrum from an Fe:InGaAs¥LED shows four peaks (1-4). Vertical lines indicate the band positions in the binary structure, InP. Energy level diagram (inset) indicates the level splitting that occurs when Fe2+ ions are substituted for In.
