DETECTORS & IMAGING: Molecular tagging velocimetry maps flow fields
A laser makes tagged fluid elements visible by changing the color of the fluid molecules, allowing the molecules to be tracked in time.
Hyoun Park, Zilan Shen, and Ann-Marie Lanzillotto
High-resolution molecular tagging velocimetry is a flow-measurement technique useful for a wide range of applications. It can accelerate the development of, and help in the discovery of innovations for, many next-generation consumer products, biomedical devices, and defense systems. Aerodynamic and hydrodynamic applications include the development of micro-injectors and flaps for active flow control, new prosthetic heart valves, and the design of marine-based biomimetic systems.
Recognizing this, Sarnoff Corp. (Princeton, NJ) established a new laboratory incorporating laser-based and other characterization techniques. The principal sponsor of this laboratorythe US Defense Advanced Research Projects Agency (DARPA)is particularly interested in the characterization of complex flow fields around and within micro- and mesoscale devices that include microrobotic flying insects and tissue-based biosensors. Other applications of the measurement system will include the study of complex flows in gas turbines, developing methods for drag, noise, and flow signature reduction, and enhanced heat-transfer capabilities. The system will also be an invaluable tool in the study of flow instabilities and turbulence.
With further modifications, the measurement technique may also be able to monitor chemical species distribution during mixing, chemical reactions, or combustion. Ultimately, this technique and its future incarnations may benefit the development of many micro-, meso-, and macroscale fluidic, chemical, and biological devices or instrumentations.
Flow measurement techniques
Existing measurement methodologies have drawbacks. For example, point-by-point measurement methods of characterizing fluid flow, including laser Doppler velocimetry and hot-wire techniques, are limited to steady or periodic flows. Full-field methods, such as particle tracking or image velocimetry, also have had only limited success at characterizing three-dimensional (3-D) flows. These particle techniques suffer from heavy computational demands and are prone to errors related to correlating particles from one image to another due to 3-D flows through the plane of illumination. Furthermore, because of inertial effects, particles are often ejected out of high-vorticity regions where information cannot then be obtained. In addition, objects or obstacles in or near regions of interest within the flow field can also deplete the area of seeded particles, making accurate flow measurement difficult.
A new flow-measurement methodology is emerging that circumvents these limitationsmolecular tagging velocimetry. The method uses fluorescent or colored molecules as flow tracers, does not have particle-seeding requirements, and is well suited to capture the full 3-D flow field.
The photochromic method
There are two different molecular tagging methods: laser-induced fluorescence/phosphorescence and the photochromic method. The photochromic method is based on a shift in the absorption spectrum of the tagging molecule. This shift typically is observed as a change in color, usually involving a conversion from a colorless to a colored form (for example, from clear to dark blue). Typically the liquid working concentrations are on the order of parts per million, with the colored molecule having a half-life on the order of seconds or longer. The tagged molecules are then tracked in time. Using beamsplitters and lens arrays, fine lines of fluid can be marked in the region of interest.
The displacement of these lines is typically captured on film or a charge-coupled device (CCD) using a short-duration flashlamp or strobe. By comparing two consecutive images at known points in time, the displacement field can be measured and used to estimate the instantaneous velocity field. With local interpolation techniques, gradients of the velocity can be determined that can then be used to estimate the vorticity field and wall shear stress distribution. Furthermore, with all velocity gradients determined, the Navier-Stokes equations (a set of nonlinear equations that describe the motion of an incompressible fluid) can then be solved for the pressure field.
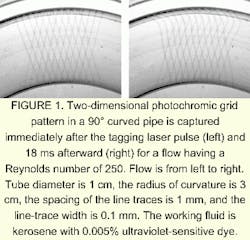
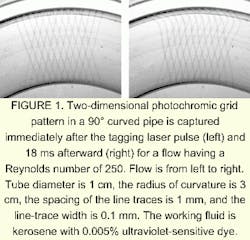
In recent work, two-dimensional
(2-D) photochromic grids were generated with line traces 100 µm wide, with an intertrace spacing of 1 mm in a 1-cm-diameter curved pipe (see Fig. 1).1 The working solution contained 0.005% by weight light-sensitive dye dissolved in kerosene.
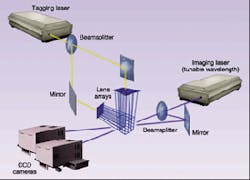
To obtain 3-D measurements, a pair of 2-D lens arrays split and focus the laser beams within the region of interest, resulting in a 10 x 10 x 10 3-D mesh or grid pattern containing approximately 1000 nodes (see Fig. 2). This grid can be scaled from a volume with 5-mm sides to a volume with sides of several centimeters using objective lens arrangements. The traces can be produced with a thickness less than 50 µm for grid patterns.
However, for single-trace applications, the trace thickness can approach several microns. The intertrace spacing is often 1 mm and can be 500 µm or less, with an effective resolution that approaches 10 µm using local modeling techniques. Local modeling will allow flow information such as velocities to be acquired anywhere within the span of the grid pattern, with an accuracy of less than 5% of the peak velocities.
FIGURE 2. In an experimental setup for 3-D laser photochromic velocimetry, a tagging laser generates a short ultraviolet (UV) pulse, which is split and focused into the region of interest. Along each line of the resulting 3-D UV grid, UV-sensitive indicators are immediately activated to a different absorption peak. A separate imaging laser, tuned specifically for the activated species, is used to capture the grid pattern at set time intervals. Two views of the 3-D grid are then acquired by cameras to stereoscopically capture full 3-D movement. Results allow the determination of instantaneous 3-D velocity, vorticity, shear stress, and pressure fields.
The ultimate resolution of the system will also be enhanced by state-of-the art image-processing techniques including edge detection and active contour methods. In terms of temporal resolution, the initial and final images are taken from milliseconds to seconds apart. By stereoscopically capturing the displacement of this grid with two CCD cameras, or with one camera placed at two different locations, the 3-D velocity field is measured.
Past photochromic studies used a xenon flashlamp to capture images of the colored tagging molecules. With its wide band of wavelengths, such a light source has limited the choice of working fluid to kerosene. To overcome this limitation, the flashlamp has been replaced with a tunable-laser light source (with a range of 220 to 2200 nm using a frequency doubler and a flash duration of 10 ns). The monochromatic and tunable output from the laser allows, for the first time, the consideration of molecules that are only observable in the ultraviolet and infrared regions. In the past, only molecules colored in the visible spectrum have been considered. The laser source allows new chemicals to be considered for this techniqueincluding effective, safe, air-compatible gas-phase species.
Testing is currently being done using water-soluble and air-based tagging molecule candidates; flow-analysis techniques are being developed for vector interpolation and local modeling. These techniques will allow the extraction of 3-D gradient fields from the complex velocity-field data. The results of the local modeling will allow the calculation of the first and second derivatives of the velocity directly from the model. From the velocity derivative fields, the wall shear stress where µ is the dynamic viscosity of the fluid, and ux is the component of velocity in the x-direction, can be determined, as well as the vorticity, which is defined as the curl of the velocity
null
Furthermore, velocity gradient fields will be used to estimate the pressure field. This will be accomplished by integrating the Navier-Stokes equations for steady, incompressible, 3-D flow
null
where r is the fluid density, p is the pressure, and g is the gravitational constant. All velocity terms in the Navier-Stokes equations will be determined using the 3-D velocity gradient field. With the gravitational term known, the equations will be used to solve for the remaining term, the pressure gradient field p. The pressure field will then be calculated by integrating the pressure gradients. Using the field gradients, vorticity, and pressure fields, all flow variables throughout the field can be determined.
null
Such detailed information is valuable in any effort to develop products where fluid-flow characteristics have a vital role in effective operation, such as drug inhalers, artificial heart valves, and coronary and vascular bypass grafts. It may also lead to many future innovations in microfluidic control of flows in microchip-based biosensors and genetic analysis instruments.
REFERENCE
- H. Park, et al., "Laser photochromic velocimetry estimation of vorticity and pressure fieldtwo-dimensional flow in a curved vessel," Exp. Fluids 26, 55 (1999).
HYOUN PARK and ZILAN SHEN are members of technical staff and ANN-MARIE LANZILLOTTO is group head of the Microsystems Imaging Technologies Group, Sarnoff Corp., 201 Washington Rd., Princeton, NJ 08540; e-mail: [email protected], [email protected], and [email protected].


