SPECTROSCOPY: Analysis of human breath holds key to disease
Ordinary human breath is rife with biomolecules that can reveal the presence or absence of certain diseases or metabolic processes. Researchers at JILA—a joint institute of the National Institute of Standards and Technology (NIST) and the University of Colorado at Boulder—have developed a method to optically sense these molecules, potentially allowing, for example, the easy detection of diseases like asthma or cancer. The scientists base their technique on cavity-enhanced direct optical-frequency-comb spectroscopy over the 1.5 to 1.7 µm wavelength range.
Their measurement device includes both gas-handling and optical subsystems; the gas subsystem delivers breath samples, calibration gases, and a reference gas (nitrogen). In the comb-based optical scheme, multiple passes through a high-finesse optical cavity enhance the intracavity absorption signal; each frequency-comb component is coupled to a different cavity-resonance mode. The integrated cavity transmission is measured, and serves to relate the amount of transmitted light to the amount of intracavity absorption.
A modelocked femtosecond erbium-fiber laser provides 40 mW of power in the 1.5 to 1.6 µm wavelength range to the instrument. To create power in the 1.6 to 1.7 µm range, the erbium-fiber laser output is sent into a Raman fiber amplifier, generating 300 mW of power between 1.6 and 1.7 µm. The cavity mirrors, which are glued airtight onto the ends of a Pyrex tube to create the detection chamber, have ultrahigh normal reflectivity over the 1.5 to 1.7 µm range.
In the instrument, a solid etalon is oriented orthogonally to a diffraction grating to form a virtually imaged phased-array (VIPA) spectrometer, which disperses the light transmitted through the cavity in two spatial dimensions. An indium gallium arsenide photodiode array captures the dispersed light. Eight 25 nm spectral ranges are acquired, covering the entire 200 nm laser/cavity spectral bandwidth.
The laser comb frequencies are dithered (periodically varied) across the cavity modes, such that the comb frequencies and cavity modes are in resonance for less than a single cavity lifetime, minimizing fluctuations due to cavity-mirror movements. As the frequency comb is dithered, it is stabilized to the cavity so that the comb modes are in resonance with the cavity at the same point in the dither cycle; the comb and cavity are thus locked together for hours of stability at a time.
The researchers use dry nitrogen to determine the instrument’s minimum detectable absorption. In one example at a 1.6 µm wavelength and after 2000 averages taken within 30 s, the instrument detects a minimum absorption of 8 × 10 ×10 cm-1 per detection channel. The researchers calibrate the spectrometer using gas mixtures that consist of 10 parts per million (ppm) carbon dioxide (CO2), 1 ppm methane (CH4), 1 ppm ethylene (C2H4), and 4.4 ppm ammonia (NH3), all mixed with balanced nitrogen; spectral lines from these four molecules encompass the instrument’s entire 1.5 to 1.7 µm range.
Analyzing images
For a measurement, the instrument produces two images—absorption and reference. A preset number of these images are acquired in real time and averaged, then an absorption spectrum calculated. A correction for laser-intensity drift between the images is calculated and applied; additional corrections such as low-pass filtering are also applied.
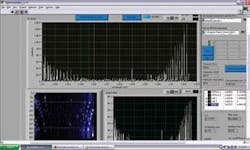
The subject first takes a deep breath and holds it for five seconds, then releases the first half of the breath into the air; the last half of the breath (the experimentally relevant portion) is exhaled into the instrument. In an example experiment, the researchers concentrate on measuring three stable CO2 isotopes. Many absorption lines are measured and a concentration computed for each of them, boosting the accuracy of the isotope-ratio measurement by the square root of the number of lines measured (see figure).
Another molecule, NH3, is a biomarker for renal failure. While the NH3 absorption spectrum overlaps strongly in general with that of H2O (water), two spectral windows—one at 1.513 and the other at 1.517 µm—each contain strong NH3 absorption lines and minimal water lines.
“The question of what diseases would be first for application is an interesting one,” says Michael Thorpe, JILA researcher. “Of course, the diseases that are already FDA-approved for breath analysis would be included. Asthma and ulcer detection would be obvious candidates. Beyond that, it would be great to start up clinical trials to try and add renal failure, diabetes, and some forms of cancer to this list.”
Applications other than breath analysis are numerous, says Thorpe. “This device has so many potential applications that we are trying to explore all of them to some degree,” he says. “Our most-recent results involve the detection of supersonic molecular jets. Also, we are currently working with companies that make semiconductor chips to detect impurities in the gases that they use to manufacture these chips. It turns out that reducing impurities in these gases could dramatically increase the manufacturing yield. I would definitely like to continue to pursue the breath-analysis work. I think continued work would be especially interesting if I could collaborate with an expert in the application of breath analysis to medical diagnosis.”
Thorpe notes that the JILA group is already working on a laser system to extend the instrument’s capabilities to the 2.8 to 5.0 µm spectral region.
