Spectral nephelometry qualifies olive oil
Extra-virgin olive oil is a favorite cooking ingredient worldwide for its flavor and nutritional advantages. But how do consumers know they are buying the real thing? And if buyers have a preferred supplier, how do they know the next bottle will be as good as the last?
The Italian olive-oil industry has recognized that qualifying and certifying its product is a necessity. Many types of extra-virgin olive oils are produced, usually by mixing oils from different origins, each blend having a characteristic taste. Each oil's taste and appearance is influenced by meteorological conditions and harvesting methods, which differ by region. Oils have different colors and turbidity, or cloudiness, and this presents a method of characterizing the oil in a laboratory test.
A research team from two Tuscan research institutes—the CNR-Institute of Applied Physics "Nello Carrara" (Firenze, Italy), and Trees and the Timber Institute (Sesto Fiorentino, Italy)—along with Loughborough University (Leicestershire, England) has developed an optical method that distinguishes extra-virgin olive oil from other oils and can even differentiate between oils produced in different areas. This work, partly sponsored by the region of Tuscany, could provide the basis for classification of Italian oils—in effect, fingerprinting each one.
null
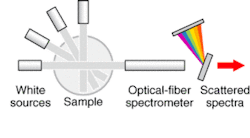
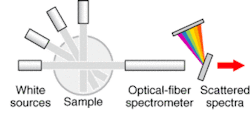
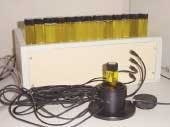
The team has used the technique of spectral nephelometry; that is, measuring the color and cloudiness of each oil. Absorption spectroscopy and multiangle scattering measurements are performed in the visible spectral range with the oil sample in a fiber-linked holder (see Fig. 1). Four white-light sources are used, each covering the range of 450 to 630 nm; the light is detected with a miniaturized fiberoptic spectrometer. The sources, positioned at different angles with respect to the detector, are used sequentially in order to measure the scattered spectra at the given angles. In addition, the transmitted spectrum is measured to provide information about the color of the sample, while the scattered spectra mainly provide information on the cloudiness, although both sets of properties are interrelated.
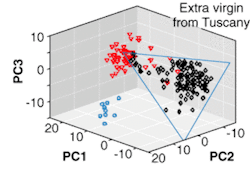
The spectral data are processed using the statistical method of principal-component analysis. This allows a reduction in the number of dimensions of the data set, while retaining its characteristic variability, so that the principal-component coordinates identifying each oil sample can be plotted on a 2-D or 3-D map, known as a nephelometric map. When many samples of oils are analyzed, the map is populated by points representing the individual fingerprint of an oil as far as its color and cloudiness are concerned.
Sorting oils by type
The group's initial experiments analyzed 68 oil samples, 10 of which were non-extra-virgin, while the other 58 were extra-virgin. Two clusters on a 3-D nephelometric map clearly distinguished the two types. The team then looked at 115 additional samples of extra-virgin olive oils, all from the Italian region of Tuscany. These oil samples had been made with olives from the same harvest, which was autumn 2002, and were produced in certified areas of Tuscany by means of either continuous or traditional oil mills. Their distinctive nephelometric coordinates were inserted in the original 3-D map (see Fig. 2). The Tuscan coordinates form a cluster, distinguishing them from the other extra-virgin olive oils and from the other oils.
"This instrumentation and analysis can be used online for quality control in the production process, including blending of different oils, and also for product definition for consumers," says Peter Smith, a Loughborough University group member. "In addition, it allows for conformity and traceability in the supply chain and will help in antifraud measures."


