Hyperspectral imaging opens life-science vistas
Hyperspectral imaging opens life-science vistas
By acquiring entire spectra simultaneously and generating images sequentially, an imaging spectrometer can build an image cube that provides more information about a sample.
Jeremy Lerner and Lee Stein
As researchers extend the boundaries of knowledge in genetics, environmental studies, molecular and cell biology, and pathology, they seek new methods to explore ever more subtle and complex reactions, responses, and interactions. Life scientists have pushed the discovery envelope so far that they now pose research questions that reach beyond the capabilities of conventional means of acquiring spectral data. Hyperspectral imaging spectroscopy (HIS) is one means by which scientists can identify and quantify the relationships between biologically active molecules.
Given a choice, researchers prefer nonradioactive-based assays such as fluorescence and bioluminescence. In recent years this preference has driven the rapid growth of fluorescence methods, biochemicals, and instrumentation. Researchers are now seeking methods to image spectral information from multiple fluorescent agents, multiple cells, intra- and intercellular features and objects, and subtle spectral changes due to pH that indicate changes in physiological properties within live cells.
In the case of cytological or histopathological materials, studies have established that spectroscopic data can indicate the presence of cancer and other diseases. To meet these needs for advanced spectral imaging, researchers are turning to new methods to acquire spectral information.
Hyperspectral and multispectral imaging
Traditional spectrometers acquire the spectra of homogeneous materials such as solutions in a cuvette. If the sample is a liquid mixture, then the researcher traditionally uses chromatography or one of the separation sciences to purify the components and then analyze the results as homogeneous materials. If the sample is a cell or tissue specimen, it is impossible to separate the constituents without changing their molecular structure or physical relationships--information that is crucial to understanding the process under investigation or making a diagnosis.
Hyperspectral-imaging-spectroscopy instruments acquire the individual spectrum of each cell component in situ and assume the material under analysis is heterogeneous. The instruments then identify spatially resolved objects based on their spectral signature.
This technique requires up to 200 spectral data points per spectral object, while multispectral imaging (MSI) requires only a maximum of 20 data points per spectral object.1 Using HIS, researchers can simultaneously acquire spectra from complex multiple overlapping fluorophores and separate them using deconvolution algorithms. As new fluorophores enter the market, researchers can extend HIS to resolve multiple fluorescent emissions generated by two or more multiplexed excitation wavelengths. New instruments capable of making meaningful acquisitions for these complex spectral applications are now making their way to the market.
Image or spectral cubes
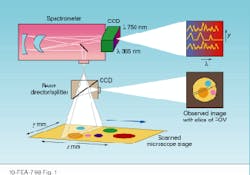
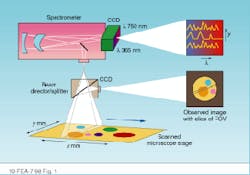
In HIS or MSI, researchers need to acquire both spectral and spatial information. Spatially resolved spectral-acquisition instruments can be designed around one of two principles: an image cube or a spectral cube. An image cube acquires entire spectra simultaneously and generates images sequentially, one slice at a time across the field of view. This method is called a push-broom acquisition because the sample is pushed or scanned across the entrance slit of the spectrometer (see Fig. 1).
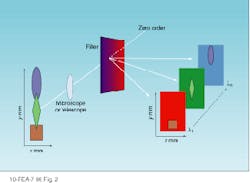
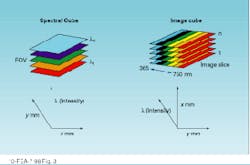
A spectral cube acquires a fixed field of view layered in sequentially acquired wavelength slices. Thus, the instrument builds a spectrum one wavelength at a time. Each pixel in the camera builds a complete spectrum defined by the number of wavelengths acquired (see Fig. 2). The cubes resulting from these two approaches present spatial and spectral data in different ways (see Fig. 3).
Instruments that create spectral cubes include acousto-optical tunable filters, liquid-crystal tunable filters, interferometers, and dielectric filters. Hardware and software can be expensive, but objects such as neurons and chromosomes are displayed as complete entities--as they are seen under the microscope. Spectral-cube approaches are well suited to locating fluorophores dispersed in cell or tissue sections.
The downside of spectral-cube acquisition is time. If the spectra within a sample can change as a function of environmental conditions or are photobleached during excitation, then the sample at the acquisition of the first wavelength may not be the same at the last wavelength. In addition, the size of a spectral-cube file slows processing speed and delays presentation of results to the researcher.
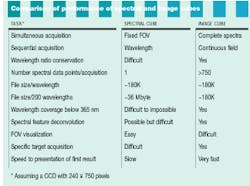
For example, if the spectral coverage is a 400-nm increment--365 to 765 nm--and 80 wavelengths are needed to enable deconvolution of multiple adjacent color centers, then the image requires a minimum of 80 acquisitions. If the charge-coupled device (CCD) has 180,000 pixels, then each file will be 14 Mbyte. In reality, future developments in fields such as high-throughput screening for new drugs, medical diagnostics, and cell physiology will require far more than 80 data points in a 400-nm spectral increment. A reasonable projection for these applications would be at least 200 data points, in which case the file size grows to at least 36 Mbyte.
Only after this massive file has been acquired and stored can the first computation be performed. Depending on signal strength, many minutes may pass before the first computation is completed. Not surprisingly, re searchers using the spectral-cube approach try to limit the number of acquisitions as much as possible without compromising results.
Two factors weigh against the spectral-cube approach in fluorescent studies. First, almost all fluorophores are subject to some degree of photobleaching or limited fluorescent lifetimes. And, second, when looking at multiple fluorophores, researchers often need to establish valid ratios between each one. Sequential wavelength acquisition can render fluorescent ratios invalid because of the finite time difference between wavelength acquisitions.
Simultaneous capture
In contrast to the sequential acquisition of wavelengths by a spectral cube, an image cube captures all wavelength data simultaneously in a 180K file (see table). An image cube acquires 242 spectra, each with 750 data points (assuming the same CCD as the spectral cube). This method allows an investigator to view a specimen in the microscope, visually locate and target a feature of interest, and then acquire an immediate, full, simultaneous spectral evaluation of the target area. Examples of applications include epitope tagging, cell organelles, cell smears, microtiter wells, and high-throughput screening. In addition, image-cube instruments are based either on a prism or diffraction-grating spectrometer, and they are relatively inexpensive.
The image-cube approach shines under several different conditions. If the sample presents a complex spectrum, simultaneous acquisition of all wavelengths allows the researcher to identify subtle spectral features. Complex spectral information such as multiple overlapping fluorophores can be individually identified using deconvolution analysis. Or, if a sample contains a bright spot that washes out weaker signals, the researcher acquires slices of the sample by positioning the slit to screen out the bright spot. The inherent downside of an image cube approach is that the spectral image of the field must be built up, slice by slice.
Find the photon
Life-science researchers need to know the origin of each photon. An imaging spectrometer provides that information--it simultaneously acquires spectra from samples viewed through a microscope, telescope, or multiple fiberoptic probes. For example, the Prism and Reflector Imaging Spectroscopy System (PARISS) developed by Lightform Inc. (Belle Mead, NJ) simply interfaces with the video port of any microscope and acquires all wavelengths from 380 to 800 nm in a single acquisition.
Unlike traditional filter-based methods, the instrument disperses light with a prism-and-mirror combination onto a charge-coupled-device camera. The images are nearly aberration free, and the prism produces a transmission efficiency of greater than 80% across all wavelengths. Traditional diffraction-grating-based spectrometers, by contrast, usually have less than 55% transmission efficiency and are optimized for best efficiency at only one wavelength in a particular polarization.
The instrument includes a second CCD to acquire the observed image. In operation, the location of each spectrum is mapped onto the observed image, so the researcher can match the spectral information to the observed structure(s). This approach allows the instrument to acquire and display spectra from up to 240 objects simultaneously--meaning that the researcher faces the potentially daunting task of sorting and categorizing each of these spectra. To solve this problem, the instrument is equipped with user-interactive unsupervised neural network software.
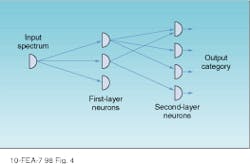
Whether the researcher is creating a spectral or an image cube, large amounts of data must be efficiently processed. The push-broom acquisition system in conjunction with a neural network greatly reduces the number-crunching burden by automatically sorting and classifying all spectra present and mapping their locations back to their origins on the sample (see Fig. 4). Another approach is to use supervised neural-network software that requires a closed universe of variables in which target objects are specifically sought and identified.2
The unsupervised neural-network software codes each class of spectra so they can be stored as only a few bytes of data. A false color can be allocated to each different class so that all spectra of that class can be painted onto an image of the sample in its false color.
Mapping cells
The instrument requires from milliseconds to seconds (depending on signal strength) to make an acquisition. It then simultaneously maps each of the 240 corresponding independent spectra to its location on the specimen. Each row of pixels in the CCD acquires a spectrum. Each row is referred to as a channel and correlates directly to the slice acquired from the specimen.
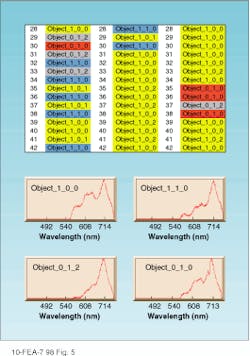
The software then sorts and classifies all spectra to identify and characterize areas in the cells such as cytoplasm, nucleus, or even candidate proteins expressed by certain DNA sequences. The process involves two steps. First, the software codes an acquisition into spectral classes that could include objects within infected cells, normal cells, background, nucleus, and cytoplasm. In the second acquisition (and all subsequent acquisitions), the software automatically recognizes and maps the location of each spectrum back to the sample. No user intervention is required for this step (see Fig. 5).
Armed with these new imaging methods and sophisticated software, researchers can now identify the spectral morphology of cells, examine spectral characteristics of cells for indications of disease, and identify and map multiple fluorescence, including intensity. o
ACKNOWLEDGMENTS
Many thanks to Dr. Sandor Vari of Cedars-Sinai Medical Center (Los Angeles, CA), Lew Drake of Process Automation Corp. (Belle Mead, NJ), and Taiwei Lu of In-Harmony Technology Corp. (Petaluma, CA).
REFERENCES
1. R. Anderson et al., "Military utility of multispectral and hyperspectral sensors," Infrared Information Analysis Center, Environmental Research Institute of the University of Michigan, Ann Arbor (1994).
2. T. Lu and J. M. Lerner, "Spectroscopy and Hybrid Neural Network Analysis," Proc. IEEE 84(6), (June 1996).
FIGURE 1. Image cubes are created by acquiring spectral data in a push-broom fashion in which the sample is pushed or scanned across the entrance slit of a spectrometer. The entire spectrum is acquired simultaneously, while the images are generated sequentially.
FIGURE 2. To generate a spectral cube, each pixel in a CCD camera builds a complete spectrum one wavelength at a time. A fixed field of view is sequentially layered one wavelength at a time.
FIGURE 3. Image and spectral cubes present their data in different formats, reflecting their differing modes of acquisition.
FIGURE 4. In an unsupervised neural network, nodes (or neurons) can be associated to accept an unlimited universe of input data, which are then sorted to produce characteristic output classes.
FIGURE 5. The output of an unsupervised neural network depicts the results of an analysis of three individual cells presented in separate columns. The numbers following the word "Object" represent the class number in the layers of the software. In the initial acquisition on the left, note that cell row 30 coded as "Object 010" and colored red is not found in the second cell, but is located in the third cell. Object 010 is a candidate protein structure, as is Object 012, colored gray. Object 100 (yellow) is the cytoplasm and Object 110 (blue) is within a specific area of the nucleus.
