Experimental measurement of the velocity, acceleration, and density of a flowing gas or liquid is important for the design of autos, aircraft, and other moving vehicles in addition to the optimization of many combustion and reaction processes. Because they can provide detailed information without perturbing the system under study, optical techniques including laser-induced fluorescence, Raman scattering, and laser Doppler velocimetry have been used for flow diagnostics.
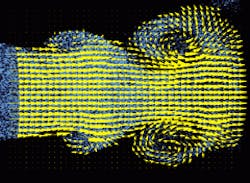
During the early 1980s, progress in the development of laser sources, image-processing techniques, and speckle interferometry led to the development of a new technique for mapping velocity and acceleration in a selected cross section of a flowing system (see Laser Focus World, June 1998, p. 75). Particle imaging velocimetry (PIV) uses light scattering by small seed particles to track their motion (see photo). Multiple-exposure photography or electronic image capture records and compares the scattered light field at two instants of time, and, under ideal conditions, a global mathematical analysis of these images using Fourier-transform techniques generates a two-dimensional (2-D) velocity map. Three-dimensional (3-D) information is produced by repeating this measurement at different locations along the flow or through the use of holographic techniques. Q-switched laser sources are often used for PIV illumination due to their high brightness and nanosecond-duration output in addition to the ease of focusing the output into a light-sheet of uniform and well-defined thickness. Many of the specifics of PIV analysis are related to the density of scatterers within a single-resolution element of the viewing system.
Determining measurement accuracy and analysis techniques
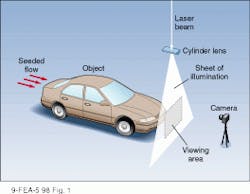
In a typical PIV setup, the fluid under study is seeded with a known density of small, light-scattering particles and illuminated with the output of a pulsed light source (typically a laser; see Fig. 1). A thin measurement region is established in the flow by shaping the illuminating beam into a plane that intersects the fluid in the region of interest. A photographic or charge-coupled-device (CCD) camera with a viewing direction perpendicular to this plane records the scattered-light intensity. With this setup, a PIV measurement is taken by using two illumination pulses, separated by a known time DT to produce a single, doubly exposed image that is subsequently processed to obtain a 2-D velocity map.In the PIV setup of Fig. 1, the ultimate resolution and accuracy of the data are determined by the particle size and density in addition to the magnification and f-number of the camera used to record the image. During a measurement, individual volume-resolution elements within the flow (known as measurement volumes) are converted to defined areas (interrogation areas) on the recording medium. Typically, one velocity vector is defined for each interrogation area, and the spatial resolution of the velocity measurement is determined by the cross-sectional area of the corresponding measurement volume.1 The specific technique used for data analysis is determined by the density of scattering images, NI, defined by
Nc = CD2T/m2
where C is the density of seed particles in the flow, D is the diameter of a circular interrogation area in the image, T is the thickness of the illuminating beam, and m is the magnification of the imaging system.2
For small values of NI (NI <<1), it is possible to track individual particles in the doubly exposed image. In this case, the distance between individual particle images is determined and used to calculate a velocity vector. Unfortunately, there is no guarantee that each interrogation area will have a particle in it or that some areas will not have multiple particles. As a result, the resolution of the technique is poor.
At the opposite extreme, where NI >>1, it is impossible to resolve the images of individual particles, and a speckle pattern is recorded. In this case, a detailed velocity map can be recovered using speckle interferometry. Unfortunately, scattering-particle densities high enough to produce a usable speckle pattern often produce flow perturbations, limiting the usefulness of the technique.
Between the extremes of very high and very low seeding densities is a regime in which good resolution can often be achieved without perturbing the flow. In addition, the interrogation area, optical system, and particle size are typically chosen to minimize statistical errors in the data analysis. While individual particle images are still recorded in this regime, the 10-20 particle images are typically present in each interrogation area and statistical techniques used for data analysis.
Several different techniques exist for recovering velocity data from a PIV image, but the most commonly used methods require determination of the spatial autocorrelation function for each interrogation area. This function has a central maximum and symmetrical peaks located at distances equal to plus-or-minus the particle-displacement vector. Thus, the displacement for a given measurement volume can be determined directly from this function in cases in which the direction of the displacement is known. In other cases, the second image in the PIV record is shifted using a moving mirror. This pro cess introduces a known bias in the autocorrelation function that al lows the direction and magnitude of the displacement to be unambiguously determined.
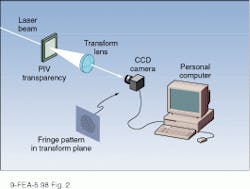
While the re quired spatial autocorrelation function can be obtained in several ways, one of the most common uses a combination of optical and digital Fourier-transform techniques (see Fig. 2).2,3 In the method, the power spectrum of each interrogation area is determined by illuminating it with a laser and recording the resulting intensity pattern with a CCD array. The Fourier transform of the image is subsequently calculated using a digital computer to yield the desired autocorrelation function. Repeating this process for each interrogation area in the image allows a 2-D velocity map to be generated by the computer. Be cause the first optical-transform process gives rise to a fringe pattern in the recorded image, the technique is commonly referred to as ‘Young’s fringe method.’All-electronic processing is also possible if the doubly exposed PIV image is recorded using a high-resolution digital camera. In this case, the image is read directly into a dedicated microcomputer that computes the velocity vector for each interrogation area directly. When compared to photographic image recording, this technique provides faster processing time at the expense of spatial resolution. In addition, certain digital camera systems make it possible to record two complete images of the illuminated flow with a separation time as short as 5 µs.3 In this case, data from the two images can be digitally combined in a number of ways, creating several unique data-analysis options.
Hardware requirements
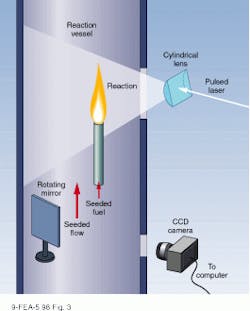
In many ways, PIV systems have hardware requirements that are shared by imaging radars and a number of other laser-excited visualization systems. For example, consider a system used by L. Munis and coworkers to study turbulent reactive flows in the Stanford University mechanical engineering department (Stanford, CA).4 In this system, illumination is provided by a dual-cavity, frequency-doubled, Q-switched Nd:YAG laser with a maximum output of 400 mJ/pulse (see Fig. 3). Because the source contains two independent Nd:YAG laser sources, the separation between pulses can be varied continuously from 5 to 50 µs. Images of the illuminated flow are imaged onto a 2000 × 2000-pixel CCD array (Kodak MegaPlus 4.2) using an f/5.6 lens and are processed using commercial software running on an IBM RISC 6000 microcomputer. With this system, velocity vectors for measurement volumes of 1.5 × 1.5 × 0.2 mm are calculated and assembled into velocity maps consisting of 66 × 66 elements.While this system has a number of unique features, including a two-cavity laser and advanced image-processing capabilities, the complexity and expense of its components are representative of PIV systems in general. Even when the PIV image is recorded on photographic film and the image processed using the Young`s fringe technique, a powerful computer with dedicated software is required to produce a velocity map. In addition, analysis of all but the slowest flow velocities required pulsed laser energies comparable to the Stanford system. For these reasons, PIV techniques will benefit significantly from increased computational power and speed in addition to CCD arrays with increased pixel density. Finally, developments that reduce the cost and improve the reliability of high-power, Q-switched lasers will be of significant interest to the PIV community.
Laboratory applications
While still early in its development, PIV has been used to study a number of interesting systems. According to one author, the technique is currently used in ‘most areas of experimental fluid dynamics’ with applications ranging from the analysis of air flow around windmill blades to combustion diagnostics.3 The windmill studies were the first to be performed outside the research laboratory and looked at the detailed motion of the air around the blades of a large wind turbine (blade diameter of 17.7 m) during operation.
Short-duration supersonic flows present a unique set of problems with respect to seeding, synchronization, and image capture that have been solved at velocities up to 900 m/s. More-esoteric applications include the study of fluid flow in model heart pumps and the visualization of the vortices produced by the wings of a flying bird (see “Digital PIV looks into the heart of the matter”). Numerous modifications of the basic techniques described here have been developed for specific applications and include the stereographic, moving sheet, and holographic techniques for visualizing velocity components along all three axes, in addition to high-speed video and cinematic techniques.
In the future, one can expect a continued increase in the laboratory use of PIV systems with the potential for significant developments in the digital hardware and software used to process PIV data. Driven by the needs of the consumer-electronics and entertainment industries, CCD-array technology also can be expected to improve at a rate somewhat slower than the processing equipment. Unfortunately, the development of the most-expensive and least-reliable component of the entire system, the pulsed laser illuminator, will be the slowest.
The commercial introduction of an economical, all-solid-state source with output energies approximating 0.5 J will probably not occur until well after the turn of the century, with any short-term improvements resulting from continued efforts to improve the design of flashlamp-pumped systems. In this respect, PIV is similar to many other laser-based applications—their ultimate use outside the laboratory awaits the development of a low-cost, highly reliable, laser source.
REFERENCES
1. R. D. Keane, "Correlation metthods of PIV analysis," in Optical Diagnostics for Flow Processes, L. Lading, G. Wigley, and P. Buchhave, eds., Plenum, New York, NY, p. 271 (1994).
2. P. Buchhave, "Particle Image Velocimetry," in Optical Diagnostics for Flow Processes, L. Lading, G. Wigley, and P. Buchhave, eds., Plenum, New York, NY, p. 247 (1994).
3. I. Grant, "Particle Imaging Velocimetry," in Optical Measurement Techniques and Applications, P. K. Rastogi, ed., Artech, Boston, MA, p. 305 (1997).
4. L. Muniz, R.E. Martinez, and M.G. Mungal, "Application of PIV to Turbulent Reacting Flows," in Developments in Laser Techniques and Fluid Mechanics, Springer, Berlin, Germany (1997).
Digital PIV looks into the heart of the matter
The complexity of the human body’s circulatory system has always made physicians, engineers, and scientists wonder about its efficiency and accuracy. The "heart" of the body’s circulation is the cardiovascular system, which consists of two main components—central (the heart) and peripheral (the blood vessels).
The heart is responsible for supplying the blood to all body organs such as the brain, liver, muscles, kidney, and skin. Efficient function of the heart is, therefore, imperative for the proper functioning of all the other essential organs. This efficiency is subject to disruption, especially when fundamental changes occur in the anatomical or physiological performance of the heart.Characterizing intracardiac flow
One of the remarkable achievements of quantitative visualization in recent years has been characterization of intracardiac flow. It presents a complex fluid mechanical system, the understanding of which is crucial in cardiac-flow diagnosis and treatment of deficiencies. The dynamics of the left ventricular diastolic filling, for instance, depends on the function of the mitral and aortic valves, particularly when a prosthetic mechanical or tissue mitral valve is implanted.
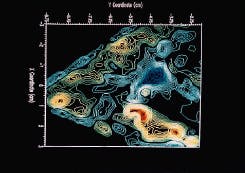
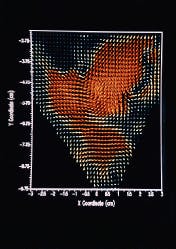
The Cardiovascular Fluid Dynamics Research Laboratory at the California Institute of Technology (Caltech; Pasadena, CA) has quantitatively visualized the impact of different transmitral flow morphologies on left ventricular filling characteristics when different valvular prostheses were used in the left heart pulsed flow simulator at Caltech under in vitro pseudophysiological conditions. These images were generated with high-resolution digital particle image velocimetry in conjunction with a 25-mJ double-pulsed compact Nd:YAG laser from New Wave Research (Sunnyvale, CA). Such analysis provides an opportunity to investigate whole flow-field mapping and detailed vorticity and stress distributions.
EDMOND RAMBOD is a research scientist and MORY GHARIB is professor of aeronautics at the California Institute of Technology, Pasadena, CA 91125.
