Measuring surface roughness can be a daunting task to start due to the overwhelming amount of information on the subject.
One common source of confusion is determining the best data collection method for the job. Several types of instruments are available for roughness measurements, each with unique strengths and weaknesses, so many factors must be considered in selecting the ideal device for a particular application.
Another area of confusion arises from the various roughness parameters. With hundreds of different parameters introduced over the last few decades, it is important to determine which are relevant to your application.
Data collection methods: From handheld gauges to high-resolution instruments
Originally, operators used handheld gauges to measure surface roughness. Height profiles were generated manually and data analysis was completed separately after the data acquisition. The process was tedious and prone to human errors.
Now, many instruments are available with a user-friendly interface, colorful data displays of acquired height profiles or images, automatic data analysis to derive roughness parameters, and network connectivity to share data with colleagues. These integrated features have considerably enhanced throughput and productivity.
However, with device miniaturization and ever-more-demanding performance requirements, the need for improved productivity has been superseded by the need for measurement accuracy. Surface finish requirements and tolerances have become stricter. Maximum values of the roughness parameter Ra in specifications are commonly in the range of 6 to 8 microinches and require high-resolution and accurate instruments.
Selecting an instrument
Each type of instrument has its own strengths and weaknesses. Selection should be based on careful consideration of several factors, such as data acquisition speed, lateral and height resolution, and scan range. For example, the atomic force microscope (AFM) can acquire height images with near-atomic resolution, but is limited by its low acquisition speed and narrow scan range. For example, this type of instrument is unsuitable for measuring roughness of the concave inner wall of tubes for quality control in a high-volume manufacturing facility.
In contrast, instruments based on visible light can quickly acquire 3D images of large samples. In addition, optical instruments are nondestructive and can probe surfaces that are out of reach for instruments requiring physical contact with the sample, such as a stylus profilometer.
One very useful type of optical instrument is the laser scanning confocal microscope (LSCM), which can acquire 3D height images with submicron height resolution. With a 3D height image, the operator can accurately locate the area of interest. This image can also help ensure that the roughness measurement is taken along the desired orientation and that it is not affected by surface contaminants. The strengths of optical instruments become particularly obvious when characterizing small samples with microscopic features or a preferred orientation.
Three considerations for selecting a laser scanning confocal microscope
The accuracy and precision of a LSCM are affected by three things: the laser wavelength, the numerical aperture of the objective, and the correction of the objective optical aberrations.
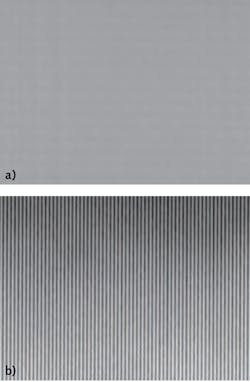
The laser wavelength. Figure 1 illustrates the effect of laser wavelength on the lateral resolution of a LSCM. Figure 1a was acquired using a LSCM with a 658 nm red laser. It shows a grating with a series of parallel lines and grooves that are 260 nm wide with a period of 520 nm. The image contrast is very low, and the lines and grooves are not visible. Figure 1b was acquired using the Olympus LEXT OLS5000 LSCM with a 405 nm violet laser. It shows a grating with narrower lines and grooves that are 120 nm wide with a period of 240 nm. The image contrast is significantly improved compared to Figure 1a, and the individual lines and grooves are clearly visible and resolved.
This example illustrates that the lateral resolution of a LSCM improves as the laser wavelength decreases. The 405 nm laser wavelength, which is at the lower end of the visible spectrum, used in the Olympus LEXT series enables high resolution measurements. By comparison, the white light used in optical interferometers and focus variation microscopes has an average wavelength of 550 nm, resulting in a lower lateral resolution.
The objective’s numerical aperture. An objective with a higher numerical aperture also improves the lateral resolution of a laser scanning confocal microscope. Further, an objective with a higher numerical aperture leads to a shallower depth of field and, as a result, a higher height resolution. It is important to note that a higher numerical aperture is usually associated with a shorter working distance, which is an issue when examining, for example, a very rough fracture surface or the inner wall of a tube.
To accommodate a variety of samples and applications, Olympus makes two series of high-magnification objectives (20x, 50x, 100x) for the Olympus LEXT series. One objective series has a higher numerical aperture, but a shorter working distance: the 50x and 100x objectives have a high numerical aperture of 0.95 with a working distance of 0.35 mm. The other objective series has a slightly lower numerical aperture with a working distance of at least 3.4 mm.
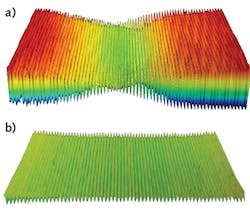
The objective’s optical aberration correction. Figure 2 shows the effect of optical aberrations (spherical and chromatic) on height measurement accuracy. Figure 2a is a height image of a grating acquired with a conventional objective. The grating should exhibit a sinusoidal waveform with a uniform peak-to-valley (P-V) height difference, but the measured P-V height difference varies significantly across the field of view. The measured height difference at the right edge of the field of view is about 7X the measured value in the center. The strong dependence of the measured height on the location in the field of view renders the measurement unreliable.Figure 2b is a height image of the same grating acquired with the Olympus LEXT OLS5000 LSCM with a LEXT-dedicated objective. LEXT-dedicated objectives are corrected for optical aberrations and designed to minimize image distortion near the edges of the field of view for the 405 nm laser. The measured P-V height difference of the sinusoidal waveform is uniform across the entire field of view.
This example shows the importance of correcting an objective’s optical aberrations for height measurement accuracy. With this design, the Olympus LEXT series can resolve features that are 6 nm high. Also, measurement accuracy and repeatability are guaranteed after calibration with traceable standards.
Roughness parameters: Understanding the measurement results
After an operator completes a measurement, the next step is to determine what the result means. Most operators typically report a single roughness parameter, Ra, which is the arithmetic mean height deviation. However, this single parameter provides an incomplete representation of the surface topography. It does not include any information on the lateral spacing between asperities, the density of peaks and valleys, or the shape of regular patterns.
To differentiate multiple surfaces with similar Ra, scientists and engineers introduced many roughness parameters that quantify specific surface characteristics, including lateral spacing, shape, sharpness, density, and preferential orientation. The definition of many parameters has been standardized during the past few decades. For example, the ISO 4287 standard defines parameters derived from line profiles, and the ISO 25178 standard defines areal roughness parameters from 3D height images. Additional parameters were designed for specific industries and applications or created by combining multiple parameters with arithmetic operators.
From a height profile or height image, the software for the Olympus LEXT series can determine close to one hundred different roughness parameters based on their definition in international standards. These parameters are arranged in six different categories, each providing information on specific surface characteristics:
- Height parameters provide statistical information on the amplitude of height profiles and images
- Spatial parameters characterize the width of features or the period of a repeating pattern
- Hybrid parameters provide information on the amplitude and width of asperities and pits
- Functional parameters are designed to optimize a specific function of a component, such as abrasion
- Volume parameters provide information on the volume of asperities and pits, which is particularly useful in lubricated friction
- Feature parameters characterize the height, curvature, and density of asperities and pits on a load-bearing surface
Faced with so many parameters, it can be hard to figure out which parameter is the most relevant to a given application. To make this important selection, you must examine the function of the surface and identify the most important surface characteristics that are relevant to the desired outcome.
One way to determine the most relevant parameters is explained in the following example. In construction, the bond strength between two concrete elements depends significantly on the interface’s roughness. To identify the parameters that are most relevant to bond strength, several roughness parameters of different categories were measured on surfaces subjected to different treatments, such as sandblasting, and the bond strength was measured with pull-off tests. By looking at the relationship between roughness parameters and bond strength through linear regressions of the data, three roughness parameters showed the highest correlation with bond strength: the maximum valley depth Rv, the total roughness height Ry, and the maximum peak-to-valley height Rmax. These three parameters were identified to be the most relevant for this application.
In summary, when selecting roughness parameters, the operator must understand the surface function and the meaning of the measured roughness parameters. The most relevant parameters correlate best with the indicator of surface performance.
About the Author
Marcel Lucas
Application Specialist II, Industrial Microscopy at Olympus Scientific Solutions
Marcel Lucas is Application Specialist II, Industrial Microscopy at Olympus Scientific Solutions (Waltham, MA).
