Beam-profile instruments improve system diagnostics
George N. Lawrence
High-accuracy beam profilers are ever more frequently used to measure the beams from all types of optical systems, from simple imaging systems to complex laser systems consisting of resonators, laser gain, optical beam trains, and nonlinear optics. Beam-profile data may consist of an intensity map at some plane, often the far-field, or, in some cases, intensity and phase maps for the near-field. We can use detailed beam profiles to determine how a laser will perform in a specific application, and, in many cases, we can even determine the specific causes of imperfect performance through reverse optimization.
Consider the case of a laser used for cutting or welding. If we measure irradiance at the image plane of the system, then we can know exactly how the laser will perform for any application by making some calculations. If the system is intended for cutting thin material, for example (such as cutting cloth for suits), the full width at half maximum may tell us exactly what we need to know.
On the other hand, if the laser beam is to be used for drilling small, deep holes, we may want to be sure that the focused beam is quite free of side lobes so that material adjacent to the hole will not be damaged. Specific performance measures, based on detailed beam profiles and supported by good diagnostic software, provide the best information as to how the beam will work in the application. As useful as this type of application-specific beam-quality characterization is, we can often do much more with the information.
Reverse optimization
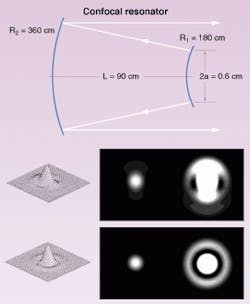
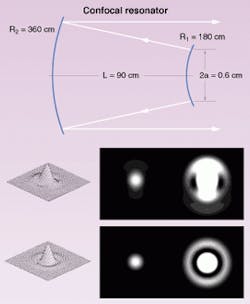
Detailed knowledge of the beam gives us the potential to determine the specific cause or causes of defects of the beam. Consider an unstable resonator in which a misalignment of 0.1 tilt wave is introduced and in which errors are evident in the far-field pattern (see figure). We will add tilt error to the ideal model until the computer model exactly matches the measured data. This process is called reverse optimization, because we generally begin with a model of the well-designed system and the ideal beam profile and search for the particular errors that will degrade the image to match the measured values.
Reverse optimizing the ideal configuration by adding tilt will lead to a good match of the calculated values. When calculated data match the measured data, we know we have the correct value of tilt.
Any type of configuration parameters can be used with reverse optimization: misalignment, aberrations of components, poorly performing gain values, incorrect aperture size and/or positioning, and so forth, to constitute a class of configuration errors. If we have multiple errors in the system, we can, in principle, correct all errors simultaneously. For a system of some complexity, this simultaneous correction is far faster than a parameter-by-parameter trial-and-error method.
The process is fairly straightforward. We need a computer model of the system that accurately predicts the beam properties as a function of the parameters. Lens-design codes capable of ray-tracing and far-field diffraction calculations may be sufficient for simple systems, but full end-to-end diffraction analysis including nonlinear gain effects of complex laser systems will require full laser analysis software, such as the GLAD program (Applied Optics Research; Austin, TX).
The optical software should also be equipped with damped-least-squares optimization. We need a description of the system in its nominal state so that we can predict the ideal performance for intensity and/or phase at the planes where the beam profile data are measured. Last, we need the intensity and/or phase maps.
To determine the state of errors in the system, we select the critical parameters as optimizing variables. For example, we might select the axial translation and transverse positioning of one or more key elements as optimizing variables. We also define the target data. For beam-profile measurements, intensity and/or phase maps serve as the target data. There needs to be some common protocol for transfer of intensity or phase-map information. A simple raster scan of values, left-to-right scans progressing from top to bottom (like a television picture), works well.
The detailed intensity maps from beam-profiled data are needed to use least-squares optimizationwe need at least as many target values as there are misalignment variables; the more values the better. More target values provide noise averaging to improve the signal-to-noise ratio. Intensity maps provide plenty of points. Many types of optimization are available, but damped least squares is the most widely used for this type of problem. It is also the principal tool used in lens-design programs.
In the optimization process, we start with the computer model set to the correctly aligned state. Any type of error information can be considered to constitute a class of configuration errors.
Starting values
It is necessary to start with some initial state of alignment. We may choose the ideal configuration, or we may guess at the configuration errors. We then use the computer model to calculate an intensity and/or phase map at the identical planes to that of the measurement. We compare the calculated data map with the measured map and record the results for each of a set of critical points or, better, of all points.
We then "bump" one of the configuration variables, recalculate the intensity map, recompare the calculated and measured maps, and record the results. Each configuration variable is bumped in turn, and the system performance is recalculated. The change in each data point versus the change in each configuration is computed to make a matrix of numerical partial derivatives called the Jacobian matrix. Matrix calculations are then used to simultaneously estimate the values of all alignment variables. The values of all configuration variables are now reset accordingly so that, hopefully, the system performance now more closely matches the measured data. We can now repeat the whole process, again recalculating the numerical partial derivatives.
System performance must be calculated many times (perhaps hundreds of times). For a laser system, full diffraction analysis will be required for each configuration evaluation. If intercavity components are considered, a diffraction analysis of both nonlinear gain and diffraction must be included, and it may be necessary to go through a settling process to reach steady-state performance. Each system evaluation step must, under these circumstances, consist of some tens to hundreds of passes through the system to reach steady-state performance. Modern computers and good software make this seemingly daunting task possible to do in reasonable time.
Does reverse optimization work? Often, but not always. It is necessary to have very good signal-to-noise ratio. Generally the more configuration variables used in the solution, the higher the signal-to-noise ratio required. Sometimes reducing the number of configuration variables by selecting those yielding the strongest effects will yield better numerical performance. Phase maps of the pupil plane, in addition to intensity maps, can be quite helpful as they respond very directly to component aberration.
GEORGE N. LAWRENCE is president of Applied Optics Research, 8127 Mesa Dr. B206-102, Austin, TX 78759; e-mail: [email protected]

