Interferometer bandwidth expanded by software

Interferometer bandwidth expanded by software
Paul J. Sullivan
Custom acquisition and analysis software integrates digital and graphic signal processing with a commercial data-handling package.
Expanding the instrument measurement bandwidth of a traditional phase-measurement interferometer (PMI) with comparatively simple optical and software modifications offers increased utility from a single measurement set-up. The modified system measures the scratches and digs, or so-called "cosmetics," that constitute the high-frequency roughness component of a test optic. The quantified scratch-and-dig information is then combined with the traditional low-frequency measurement obtained from the conventional PMI.
At the National Institute of Standards and Technology (NIST, Gaithersburg, MD), software has been developed to acquire and analyze image data obtained from a CCD camera (Cohu; San Diego, CA) used in this enhanced-bandwidth PMI system. This software integrates digital signal-processing and graphic signal-processing frame-grabbing routines (DIPIX Technologies; Ottawa, Ontario, Canada) with the analysis capabilities of MATLAB matrix analysis package (The MathWorks; Natick, MA).
Hardware set-up
The optical test measurement system is a flexible open-bench-top design (see Fig. 1). Optical components are mounted on a vibration isolation table (Newport; Irvine, CA) in a temperature-controlled laboratory held at 20°C ± 0.5°C. The system features a Twyman-Green interferometer that includes a 632.8-nm HeNe laser source (Melles Griot; Irvine, CA) coupled to a beam expander and a collimator to produce a 1.25-cm-diameter beam. A prism is used to discard much of the light intensity, and a Newport ND30 neutral density filter also reduces the amount of light falling on the CCD. Using a conventional commercial interferometer, the test and reference surfaces were measured to rms values of approximately 200 nm.
Because of the open-bench-top design of the test set-up, there is considerable stray light contributing to system noise. To reduce this, a HeNe wavelength filter was introduced in the camera lens. Coated lenses are also used to curtail interference between parallel surfaces within the interferometer. The interferogram is digitized by focusing the interference beam on the CCD camera and digitizing the video signal using a DIPIX frame-grabber card. Resolution of the acquired interferogram image is 512 ¥ 480 pixels.
Imaging procedure
The camera is focused to produce a sharp image of the test surface on the CCD. A stop is then introduced at the focus position of the interference pattern, blocking the interference beam but allowing some of the scattered light from the test surface to be focused on the detector. This scatter pattern is digitized and analyzed using the microcomputer. By removing the neutral density filter and adjusting the camera gain, more detail can be obtained.
Clearly, the scattered light can originate from any reflecting surface within the system. Light from the reference mirror can be reduced by positioning the mirror out of focus. However, an original requirement for the design of the system was that it should allow for modification of existing interferometers where such mirrors are obviously a common arrangement. Thus, the problem that arises is the requirement to separate the scatter off the test mirror from the main system.
A solution is to shear, or move in-plane, the test mirror. Thus, only the scattered light that moves originates from the test mirror. This requires the measurement of at least two intensity patterns, Ir (reference) and Is (sheared). The scattered light from the test mirror is characterized by the difference It = Is-Ir. Note that It contains both a positive and negative image of the scatter.
Further enhancement of the scatter image is done by a threshold operation to remove the duplicate scatter image. Furthermore, by thresholding the "positive" image to reduce the influence of noise, a binary image can be obtained, isolating the spatial-scatter information. These data can then be analyzed using statistical, image-processing, and other numerical-analysis tools.
Software configuration
For flexibility and to facilitate rapid development of acquisition and data-analysis software, it was preferable to use existing packages where possible. The frame-grabber card is supplied with a reasonably comprehensive selection of acquisition and analysis routines in a Windows dynamic link library. How ever, it was deemed desirable to facilitate much of the analysis off-line on PCs without the digital/graphic signal-processing board. Thus, it was generally decided to use only the acquisition portion of the DIPIX software.
As the core of the data analysis involves matrix-based processing, including two-dimensional signal- and image-processing functions, MATLAB was an obvious choice to perform the analysis. While providing comprehensive analysis and data representation facilities, MATLAB`s command-line interface is difficult for nonprogrammers to learn. Thus, a "front-end" to the acquisition and analysis routines was written using Delphi (Borland; Scotts Valley, CA). The "front-end" communicates with the MATLAB processing engine using a dynamic data exchange link and the DIPIX acquisition software using the dynamic link library.
When an analysis command is selected from the menu, the appropriate MATLAB command string is generated using the values of the internal client variables. For example, to produce an axonometric plot within MATLAB, the following command is sent to the MATLAB engine:
figure;mesh(x,y,z),view(-37.5,30);colormap(gray);colmenu;
The string is also displayed in the status window for debugging and generating macros (see Fig. 2). Several dialogs have also been created to enable point-and-click selection of parameters such as grid type, projection angles, and colors.
This developed client software was written to provide an object-oriented wrapper to the MATLAB engine. Each image or surface data set is treated as an object. This includes the image data as well as scaling information, historical processing, and so forth. The list of current surface objects is given in the "surface" section of the main screen. Destructive processing of a surface object (that is, an operation, such as producing a binary image, that cannot be reversed without accessing the original data) yields a new object. Previous process stages can be selected from the list of objects. Objects can be renamed for ease of recall and can be added or subtracted, on a pixel-by-pixel basis, from any other object. The MATLAB variables representing a specific surface object can be displayed by double-clicking on the object name.
Particular use was made of the MATLAB image-processing toolbox. The test image, which is the difference of the two sheared intensity images, thresholded at zero, is called up and a region-of-interest selected via the mouse. The intensity distribution of the zoomed image is then displayed and used to assist thresholding to produce a binary image. Morphological operations are performed on these binary images, which can then be analyzed using statistical techniques. Scatter-site distribution (that is, their location and relative size) is thus quantified. Furthermore, the two-dimensional autocorrelation and fast Fourier transform functions determine periodic dependencies in the scatter sites.
Measurement of quantifiable high-frequency scatter information is thus possible by relatively simple modification of an existing interferometer coupled to a camera, frame grabber, PC digital hardware, and acquisition and analysis software. This method of implementing software procedures maintains the flexible approach necessary for development purposes while integrating a user-friendly front-end with a well-established powerful numerical- and image-processing engine. n
Author`s note: Mention of specific commercial equipment, instruments, and materials does not imply recommendation or endorsement by the National Institute of Standards and Technology nor does it imply that the materials or equipment are necessarily the best available for the procedures described here.
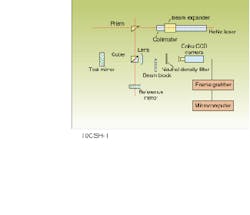
FIGURE 1. Test set-up for determining optical characteristics of a test- mirror surface uses a prism and a neutral density filter to attenuate light within the system and entering the CCD camera, respectively.
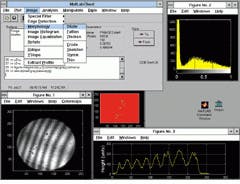
FIGURE 2. Graphical user interface of modified MATLAB-based interferometer analysis package allows point-and-click simulated morphological operations on test-object image data.
PAUL J. SULLIVAN, from the University of North Carolina (Charlotte, NC), is a guest researcher at the National Institute of Standards and Technology, A903 Administration Building, Gaithersburg, MD 20899.