Integrated simulation platform models optoelectronic devices and systems
Integrated simulation platform models optoelectronic devices and systems
Khurram Kazi and Eric Donkor
A great deal of research has been done in developing basic optical and optoelectronic components, such as amplifiers, encoders, multiplexers and de multiplexers, sources, and detectors. These devices are being used in the development of optical computers, lightwave communication systems, image-processing equipment, business machines, and so forth. Conventional development and debugging of these systems is based on breadboarding their design. This research-and-development procedure can be cumbersome, time-consuming, and inefficient, increasing the cost of optoelectronic systems. The Very High Speed Integrated Circuit Hardware Description Language (VHDL) for modeling and simulation of photonic systems and devices is being used extensively for synthesizing very-large-scale integrated devices, such as those at Trans Switch (Shelton, CT). 1
Its inherent features make VHDL easily adaptable for modeling and simulation. For example, the code can be written in modular form, and the parameters between different modules can be passed with great ease by using port constructs (input, output, and bidirectional ports). These ports can transfer information in the form of digital signals, integers, real and floating-point numbers, strings, arrays, or any user-defined signal types.
The digital optical signals use the presence or absence of light to define the binary states, represented by "1" and "0," respectively. Time-varying signals (phase changes) can be represented by real, floating, complex, or integer numbers. Vector quantities such as polarization and electric fields can be modeled by using matrix formulations. When an optical signal has multiple discrete states and cannot be described in binary form, the signal can be described in VHDL by defining a new type, based on user-defined states.
Double-heterostructure laser
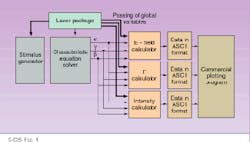
Modal analysis of a double-heterostructure laser using VHDL features a symmetrical three-layer slab-waveguide model. This analysis requires evaluation of eigenvalue equations using numerical techniques. The modal analysis uses the needed VHDL blocks to find the even modes of the transverse-electric (TE) field (see Fig. 1). Electric field, confinement factor (G), and intensity distributions are determined for various device parameters such as active-layer thickness and cladding-layer refractive indices. This analysis is facilitated by using "global signals" and a testbench concept.
Additional parameters, such as refractive indices of active layers, operating wavelength, constants such as p, the maximum number of iterations to be performed, tolerance, and initial guess value are compiled in the laser package. The global signals are used by the characteristic equation solver, electric-field-strength (E-field) calculator, G calculator, and intensity calculator blocks. A stimulus generator changes the values of the global signals at various stages of the simulation so that the E-field, G, and intensity distributions for various device parameters can be calculated.
The characteristic equation solver uses the Newton-Raphson method to solve the characteristic equation and calculate the propagation parameters. These parameters are then used in generating ASCII data files of the electric field and intensity distributions vs. distance and the confinement factor vs. active-layer thickness. The data files are then fed to a commercially available plotting program for drawing the curves.
Optical network model
The Jones matrix formulation is a very useful method in the analysis of interactions of incident uniform monochromatic TE plane waves with optical devices. The vectorial and polarization components of the electric-field vector, E, are represented concisely using two-component complex Jones vector notation E(Eu, Ev), where u and v are basis vectors. The electric-field vector can be characterized completely in terms of its state of polarization, amplitude, phase, and intensity.
The interaction of the incident wave with an optical device can result in a change of the field vector. If the quantities Eu = |Eu| ejdu and Ev = |Ev| ejdu represent phasor components of the generalized Jones Vector, then their ratios define a single complex number that completely and uniquely describes the ellipse of polarization of the elliptical field. A complete set of tools for simulating the interaction between optical signals and optical devices is provided by the four transfer functions: polarization transfer function to characterize the polarization of the optical field; amplitude transfer function or intensity transfer function; the square of the amplitude, for characterizing the attenuation or amplification; and the phase transfer function to relate the positions of the electric-field vectors at the device input and output.
For illustration, an optical circuit was chosen consisting of several devices including a laser and a corrugated grating waveguide (see Fig. 2). In this circuit, inputs to an optical element (Tij_in, matrix elements of previous stage), phase, polarization, and amplitude are operated upon by the appropriate transfer function (Tp) and result in the outputs: Tij_out, phase, polarization, and amplitude. The cumulative effect of all the optical devices on the incident optical signal is described by PHASEout, AMPLITUDEout, and POLARIZATIONout of the nth device. Devices such as distributed-feedback lasers and reflectors or fiber gratings in which the transfer matrix is simply that of a single period raised to the nth power, can be modeled by stacking using a "bottom-up" hierarchical approach. The transfer matrix of a single period of the grating is iterated n times using a "generate" statement to calculate the cumulative transfer matrix.
In modeling the optical system with matrix methods, the optical signal can be determined at any intermediate node to derive polarization, phase, and amplitude information at points within the system. The methodology allows modeling of systems having digital, analog, and optical components in the same environment.
Future of optical synthesis
Whether for optoelectronic integrated circuits or an optical system consisting of discrete devices, to date, there are no tools that can perform optical synthesis from the hardware description language model. One approach that may bring us closer to the realization of optical synthesis would be the use of Jones calculus. Here four device parameters, composed of two eigenpolarization states (ce1 and ce2) and two eigenvalues (Ve1 and Ve2), can be used to uniquely classify optical devices. Therefore, for synthesizing optical systems or optoelectronic integrated circuits, libraries of optical components based on ce1 and ce2, Ve1 and Ve2, parameters have to be developed. n
REFERENCE
1. K. Kazi and E. Donkor, Opt. Engin. 34(5), 1450 (May 1995).
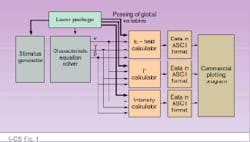
FIGURE 1. Using a modular approach, modal analysis of a double-heterostructure laser is performed by solving the characteristic, field-distribution, and confinement-factor equations in different subunits. Various parameters are communicated between the subunits via the ports and the global signals.
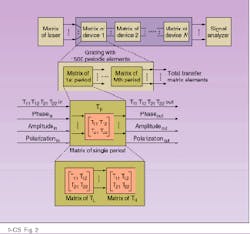
FIGURE 2. VHDL design methodology can be used to develo¥a four-level hierarchical model of a grating, with 1500 periodic elements.