Single-source unit automates laser-diode testing
Single-source unit automates laser-diode testing
Reinhard Fink
Before shipment to customers, laser diodes must be tested to ensure that they can adequately transmit data over optical fiber. The primary test criterion is the intensity level of emitted light at a given current. Typical test methods require that each laser diode be integrated into its housing structure and fitted with the necessary optical devices for data transmission. Only after these costly manual operations can technicians determine the operating characteristics of a diode or its acceptability.
Siemens AG Semiconductors (Regensburg, Germany) has developed an alternative approach that upgrades this inefficient test procedure to a computerized, low-level-light measurement system that improves both the quality and speed of the test procedure. A commercially available test system, coupled with an innovative test fixture, quickly verifies laser diode transmission performance.
Of primary importance was the requirement to develop an accurate material-handling method in the form of a premount, which is a common carrier with a predetermined grid that accepts several laser diodes. Because laser diodes emit light sideways, the mount has two glass prisms that reflect the light from the diodes by 90° and aim it upward to the fiber that directs it to the measuring equipment. The mount also makes it possible to automate sequential optical measurements on a number of premounted diodes at a single workstation.
An important consideration was accurate placement of the voltage and current measurement probes on the relatively small bonding pad of each diode. Two probes touch the diode pad, and two act as grounds on the opposite side of the carrier plate. Minor deviations in probe placement from one diode to the next eventually cause the probes to miss the pad altogether. A no-hit reading is interpreted as a defective diode, resulting in possible rejection of a good diode. An automatic wafer prober eliminates this concern and delivers travel-path tolerances of 2 µm as the probes move from one diode to the next.
Compact measurement cycle
The measurement sequence, which features a number of cycles, is a diode-specific software macro executed from a PC that controls the wafer prober and test equipment. The measurement cycles can be lengthy, resulting in large macros that take up a great deal of PC storage space. This handicap has been overcome by compacting the cycle sequence using the command syntax of a single instrument, the Model 238 Source-Measure Unit (SMU) from Keithley Instruments (Solon, OH), which delivers and measures both current and voltage. By chaining software commands, operators can change parameters by altering only one line in the measurement macro.
The first measurement cycle determines if a diode is actually in place on the premount. Current is preset to 10 mA, which fixes the maximum possible voltage at 2.5 V. A semiconductor characteristically has a forward voltage Vf of 0.8 to 1.2 V when supplied with any current level, so the test sequence checks for a Vf of approximately 1 V to verify that a diode is in place. If Vf is 2.5 V, the controller recognizes there is no diode in position and ends the test cycle. The program then indexes the probes to the next diode position on the premount.
Measuring light intensity
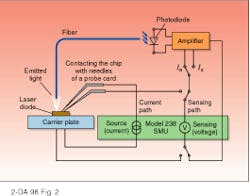
To measure light intensity, the SMU generates light by applying a current to the laser diode though the wafer probes. A photodiode connected to an amplifier receives the light from the laser diode via an optical fiber. The SMU`s remote sensing leads, which are connected through a switch to the output of the amplifier, measure the voltage signal and use it to calculate the light intensity.
This light-output test does not actually measure an electrical parameter of the laser diode, but rather calculates the value of an external unit Ee from the measured voltage. The changes in Ee corresponding to changes in applied current I create the laser diode`s characteristic curve, the slope of which indicates diode efficiency. The intensity of emitted light should in crease linearly with ap plied current above a threshold value Ith. For high-quality diodes, this characteristic re mains stable within a specified temperature range.
Although the relationship be tween applied current and light intensity should be linear, actual production measurements reveal nonlinear characteristics, or kinks, in the curve. As a rule, kinks are not readily visible from a simple plot of the characteristic curve. The first derivative of the curve is more likely to reveal the presence of kinks; excessive kinking is a reason to reject a diode.
The main test cycle optimally creates a characteristic curve using only 50 current-to-intensity measurement points. The 50 points must lie between the threshold current Ith and the current necessary for the diode to deliver the required minimum light level. Both of these current levels are unknown and must be identified as part of the test procedure. This measurement cycle begins with the test instrument in dc mode. Increasing current levels are set while the light value is checked after each increment. From the measured light value, the PC determines a new nominal current for the instrument to apply. When the minimum light level is reached, the procedure stops.
To shorten this process, the current step size is set relatively large (5 mA). Once the threshold and minimum-light currents are identified, the software calculates the start and stop currents for the main measurement sequence, allowing for 50 measurement points. The instrument, now furnished with start and stop currents and step size, uses its sweep mode to generate a current for each of the 50 measurement points. A subsequent trigger command activates the light-intensity measurement at each point.
Because each measurement has a resolution of five significant figures, the integration period for every measurement point is lengthy (20 ms). Despite this delay, the 50 points are completed and all values transmitted to the PC in less than two seconds.
Calculating electrical values
After completing light measurements that create the Ee characteristic curve, the next test sequence generates the Vf characteristic curve. This calculation uses the same instrument setup as the light measurements simply by switching the remote sensing leads from the light amplifier back to the measurement probes at the laser diode.
The same trigger command runs the test instrument through the applied current values to create the Vf characteristic curve. Here, as well, it takes a maximum of two seconds for the PC to receive all measured Vf values. Calculation algorithms now determine the steepness of the curve, the kinks present, and the dynamic resistance of the diode, after which, the measurement probes are stepped to the next diode site.
The wafer prober provides not only rapid detection of static values, it also marks defective diodes with colored ink. A resolution of 3.5 digits proves adequate for static measurements and gives clear, usable results on the differential value of two working points relatively far apart. However, when tracing the characteristic curve of the diode from which the first derivative is calculated, a resolution of 3.5 digits results in derivative curve noise. This prevents observance of any kinks and, hence, prevents detection of defective laser diodes. Tests using 4- and 5-digit resolutions showed that the former still produces noise while the latter produces a laser characteristic curve that reveals kinks, should they exist.
To compensate for variations in PC speed and diode temperatures, the test procedure was changed from its initial dc operation to a sweep-mode (pulse) operation. Operators program the pulse lengths and pulse recovery times into the software driving the SMU. By triggering the pulse it is possible to synchronize all measurement stations. An added benefit is a reduction in the number of commands from the PC to the SMU. Fewer commands shorten the measurement sequences, thus effectively increasing throughput at the measuring stations.
Siemens continues to develop component testing operations with Keithley Instruments, which is expanding its production testing and characterization operations to test both active and passive optoelectronic components. o
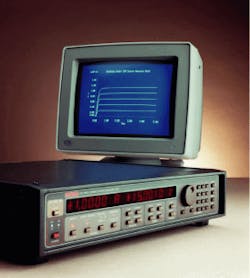
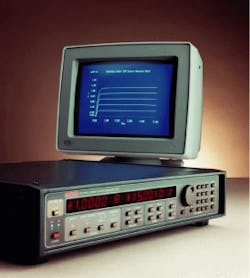
FIGURE 1. A single-source measuring unit, when integrated into a laser-diode testing workstation, can measure both resistance and optical output power and eliminate time-consuming manual operations.
FIGURE 2. In this test equipment configuration, the remote sensing leads of the Source-Measure Unit are switched from the probes to the photodetector amplifier as the test proceeds from validating diode voltage to measuring light output.


