Software analyzes ghost images on Megajoule laser
Software analyzes ghost images on Megajoule laser
Hervè Benard
The Megajoule laser project is the largest optics project ever constructed in Europe and will replace nuclear testing with simulations. The laser will incite the controlled nuclear fusion of deuterium and tritium to en able thermonuclear plasma physics. It will consist of 240 beams, and each beam will supply close to 20 kJ of energy at a wavelength of 1.05 µm.
The first simulations with the Megajoule laser at the Centre d`Etude Scientifiques et Techniques d`Aquitaine, close to Bordeaux in France, are scheduled for the beginning of the next century. Laboratories and companies collaborating on this project include the Laboratoire de Limeil-Valenton in France and Lawrence Livermore National Laboratory in the United States (Livermore, CA). Optis (Toulon, France) developed a new and specific software module called CALIPSO (calculation of ghost images in optical systems) for the Megajoule laser project that is integrated into the company`s SOLSTIS software--optical design and analysis software that enables the simulation and analysis of laser propagation, fiber coupling, and photometry.
CALIPSO focuses on the complete analysis of ghost images in the laser cavity. CALIPSO was developed with the help and scientific advice of the Commissariat à l`Energie Atomique and the Direction des Applications Militaires (CEA/DAM).
The Megajoule laser will be amplified with a multipass cavity, which can generate many ghost images. In fact, beam reflections occur on lens faces, propagate in the whole system, and can focus in several points. Some of these reflections also can be amplified. Furthermore, focusing points can be located near or inside optical elements, and their fluence can exceed the glass damage threshold. Therefore the goal of the software is to detect hot spots and to verify if they are dangerous for the laser.
The constraints of the project are calculation time and accuracy. Because these constraints are antagonistic, the software has been developed in two phases. The first one is fast but not very accurate. It allows detection of potentially dangerous hot spots. The second phase is an accurate analysis of the powerful spots.
CALIPSO phase I
The aim of the first phase is to make a quick analysis of ghost images: locating hot spots, calculating fluence in hot spots, and calculating fluence on the faces of the nearest optical elements. For example, the amplification cavity is made of about 340 surfaces. So, at the first order, we find 57,630 potentially dangerous images. At the second and third order, this number grows to 13,043,590 and 2,767,690,355, respectively. The quick pretreatment is based on a generalized paraxial analysis, developed by both CEA and Optis. This calculation takes into account the elemental aberrations, along with factors such as amplification and the recovery of pencil beams. The results of the first phase tell the user which reflections are dangerous, as well as their approximate fluence and location.
System design
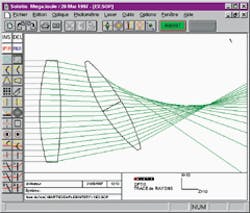
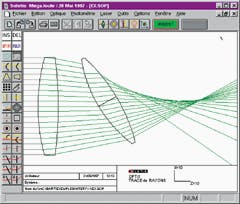
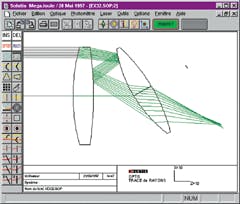
SOLSTIS allows the design of optical systems such as the one in Fig. 1. After the system has been designed, CALIPSO makes it possible to analyze particular reflections. For example, one can study the reflections at the first and third order, which yields a file describing the corresponding sequences. The sequence 3,2 means that the beam is reflected successively on faces 3 and 2. The software generates the new optical systems for each sequence automatically. Figure 1 shows the system generated for the sequence 3,2.
The first phase of CALIPSO is based on a generalized paraxial analysis. It allows one to quickly obtain both the location and the fluence of hot spots. The results of this process are recorded in a text file. Because there are a lot of images, one can sort them using several criteria, such as the fluence of hot spot, the fluence on the face of the optical element that is the nearest from the hot spot, and the image type (virtual or real). Overall, phase I provides a fast analysis of many ghost images. It gives reasonably accurate image locations and overestimates hot-spot fluence by a factor of 1 to 5. It also allows selection of the potentially dangerous images. The selected sequences can then be studied with more accuracy in the second phase.
CALIPSO phase II
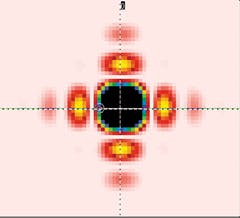
Phase II is based on a rigorous analysis of coherent propagation, taking into account amplitude and phase distribution. The results are accurate for both location and fluence. The parameters for the simulation were derived in phase I. Dimensions of the maps and values of fluence are also displayed in the software, including visualization of irradiance map at any point of the propagation axis, display of beam sections in any direction, calculation and display of maximum fluence versus analysis plane position, and display of physical parameters, including transverse dimensions, beam energy and fluence at any point of the map (see Fig. 2).
In accordance with the Huyghens-Fresnel principle, the input beam is decomposed on a sum of punctual sources. Each punctual source is also decomposed on a complex sum of plane waves. This method allows consideration of the phase and amplitude distributions. Each plane wave is represented with a ray, normal to the wave, and is emitted by a Monte Carlo technique. The rays are propagated through the optical system using the principles of geometric propagation. Finally, the plane waves are integrated in the Fourier domain, which gives the complex amplitude of the image (A(k)). The irradiance map is obtained with the square modulus of the Fourier transform of this complex amplitude.
We have compared some results, obtained with phase I and phase II, to the MIRO Fourier-based software developed by the CEA. The results given by MIRO are assumed to be correct. The comparison indicated, as stated previously, that the fluence is overestimated in phase I, but that phase II is totally accurate.
The Megajoule project has allowed Optis to perfect the SOLSTIS software`s laser-propagation module and to validate it under extreme conditions. Optis is pursuing its development of the analysis of coherent lighting systems to take into account such physical phenomena as scattering on mechanics and optics. o
FURTHER READING
For more information about the Megajoule project, please see the French edition of Scientific American, Pour La Science (December 1997).
FIGURE 1. Once an optical system is designed (top), it can then be analyzed for first- and third-order reflections (bottom).
FIGURE 2. Sample optical propagation map shows irradiance from the focal point for an optical system with no aberration.


