NANOPOSITIONING EQUIPMENT: Understanding noise at the nanometer scale
JAMES F. MACKAY
Nanopositioning is basic to research in virtually all areas of nanotechnology and, because it implies very small movement controlled with a high degree of accuracy, it seems intuitive to seek a specification of a nanopositioner’s resolution. Simply stated, what is the smallest motion that can be produced or measured by a given design? Some applications, like those involving optical microscopy, do not often test the limits of nanopositioning. Other applications, such as laser-particle tracking or scanning-probe microscopy, can push the limits of nanopositioning resolution.
A high-resolution nanopositioner comprises a flexure-guided stage that is actuated with lead zirconium titanate (PZT) ceramic piezoelectric actuators and a position sensor that supplies a feedback signal to the control electronics. The intrinsic noise in a nanopositioning system comes from the sum of the noise from these components. The intrinsic noise is the fundamental limit for resolving small signals, and the resolution specification is best thought of as electronic noise expressed in terms of physical motion.
To more accurately define the term “resolution,” we use the term “position noise” to quantify the effect of all noise sources on the complete system. Accurate motions cannot be produced or measured at dimensions below the specified position noise. To further complicate the picture, we should not simply specify a single number for the position noise, but instead should specify position-noise amplitude as a function of frequency. This makes sense because we are, after all, talking about a motion stage, and it is important to quantify the time-dependent stability of the system.
Nanopositioners are often used as scanners in the frequency range between 1 and 20 Hz; for such applications, users frequently wish to measure position at frequencies up to 1 kHz. Other applications require the nanopositioner to move to a position and stay there for long periods of time. No matter what the application, it is useful to understand more about the time dependence and sources of position noise.
Measurement techniques
Precision nanopositioners incorporate position sensors that provide a feedback signal to the electronic controller to eliminate the creep and hysteresis inherent in PZT actuators. The position sensor allows the controller to constantly adjust the driving voltage to maintain a fixed position; Mad City Labs uses its proprietary piezoresistive-based sensors with ultralow noise. The noise source for a piezoresistive sensor is Johnson noise, and is typically in the range of 0.001 to 0.020 nm (1 to 20 picometers), depending on the application. This inherent low noise is the result of the sensor’s low resistance and very high sensitivity. Additional noise added to the system by feedback electronics is not easily quantified without a measurement of the systems position-noise characteristics.
Measurement of position noise for a specific nanopositioner design would seem fairly difficult. Low-noise amplifiers combined with low-impedance, low-noise position sensors produce a position noise that is well below the limits of precision instrumentation. In the subnanometer region, even interferometry cannot produce the required measurement accuracy. Fortunately, noise power-spectrum analysis using fast Fourier transforms (FFTs) is an established technique useful for quantifying noise. For example, the semiconductor industry uses power-spectrum analysis to specify voltage noise in operational amplifiers and transistors. The analysis can be done with standard data-acquisition boards-usually with 16-bit resolution or better-and FFT power-spectrum software (available from multiple vendors such as LabView and Matlab).
Reference signal
The procedure used by Mad City Labs calls for driving the input of the nanopositioning system under test with a reference signal, which is a sine-wave signal of known amplitude and frequency scaled to produce a small displacement. The output signal from the position sensor is continuously digitized at a fixed acquisition rate and for a fixed data-record length. Each record therefore contains amplitude and frequency information from the position sensor. The data record is then Fourier-transformed to generate a power spectrum of the measured voltage versus frequency. By using a reference signal of known amplitude and frequency, the spectrum can be scaled to reflect the peak-to-peak noise-power spectrum of the nanopositioner. Displaying the noise spectrum in this way makes sense because we are more interested in the peak-to-peak displacement of the system rather than the average displacement.
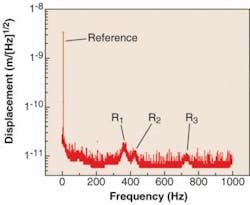
An example position-noise spectrum of a nanopositioner with 100 µm range of motion demonstrates the benefit of using a known reference signal, in this case a 3.5 nm peak-to-peak displacement at 7 Hz (see Fig. 1). With a measurement resolution of 0.01 Hz, the reference signal is more than 100 times larger than the largest background noise and is easily resolved. Note the peaks labeled R1, R2, and R3, which are due to stage resonances. PZT actuators are typically modeled as a capacitor with a leakage current, and their position noise is limited by the shot-noise-induced fluctuations of the actuators’ applied voltage. For most PZT actuators the position noise due to leakage-current shot noise is less than 0.001 nm. For mechanically amplified flexure stages, the shot noise is amplified by the stage resonance, and is usually a maximum at the stage resonant frequency, but rarely the source of limiting position noise. None of resonances has a peak-to-peak amplitude greater than 0.02 nm.
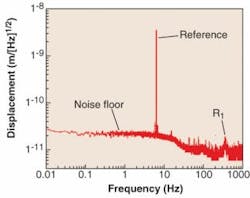
The weakness of plotting the data on a linear scale is that it deemphasizes the low-frequency behavior of the nanopositioner; plotting on a log-log scale solves this problem (see Fig. 2). The spectrum is mostly flat from 20 Hz down to 0.01 Hz, with a noise floor of about 0.03 nm. The spectrum indicates that this is a very stable low-drift stage on this time scale. In addition, there is no evidence of a 1/f noise-corner frequency down to 0.01 Hz. Nanopositioners using capacitance sensors or LVDTs (linear variable-displacement transducers; nonoptical devices with a movable magnetic core) sensors generally exhibit a strong 1/f noise below 1 Hz, which is not evident in state-of-the-art piezoresistive sensors.
The minimum resolvable motion of this nanopositioning system is specified to be 0.03 nm peak-to-peak, representing a position noise better than three parts in 10 million (100 x 10-6 m divided by 0.03 x 10⁻⁹ m). While this “resolution” can be well below the capability of the user’s input-signal circuitry, it does illustrate the ultimate limitation of this nanopositioner with its associated controller. If a digital-to-analog converter (DAC) is used to provide the input-position command signal, 24 bits of resolution is needed to produce a dynamic range of input signals equivalent to the complete resolution of the nanopositioning system. A more typical 16-bit DAC would provide only 1.6 nm incremental change per least significant bit (100 x 10-6 m divided by 216 ).
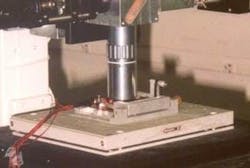
Nanopositioners are rarely stand-alone instruments (see photo). In fact, most applications incorporate the nanopositioners into larger systems that can degrade the performance of the nanopositioner or limit the user from getting the full benefit of the nanopositioner’s low position noise. Nanopositioner performance is compromised, for example, when not isolated from building and acoustic vibration. Fortunately, the user can implement the technique described above to analyze the position noise of the larger system to establish the resolution limit.
James F. MacKay is a member of the R&D group at Mad City Labs, 2524 Todd Dr., Madison, WI 53713; e-mail: [email protected]; www.madcitylabs.com.


