An old material finds a new application
The approach to optical lithography most likely to be implemented after 157-nm lithography is extreme-ultraviolet lithography (EUVL). This technology will allow chipmakers to produce features that are 70 nm and smaller. Unlike previous generations of optical lithography, EUVL will necessitate a totally reflective imaging system. The use of an all-reflective optical system for lithography is not new; a system was built and marketed in the 1970s by PerkinElmer (later purchased by SVGL, Wilton, CT; then in turn acquired by ASML, Veldhoven, The Netherlands). However, since EUVL operates at a 13.4-nm wavelength, the photomask (commonly called a reticle) will also be a reflective component of the lithography system, introducing a new set of requirements.
The list of optical materials available for use in lithography systems has become limited as the illumination system wavelengths have progressed from the mercury g-line (436 nm) to the fluorine-laser-generated 157 nm. The 13.4-nm EUVL wavelength will place demanding requirements on fabricators and material suppliers for both EUV optics and reticles. Significant differences between the EUVL reflective mask substrate and the current optical lithography mask substrates exist in areas such as surface roughness, flatness, and coefficient of thermal expansion (CTE). Thermal stability via a low CTE becomes the critical property for EUVL masks, as opposed to transmission specifications for optical system reticles.
One glass type under consideration is a fused-silica/titanium dioxide (SiO2/TiO2) binary glass produced primarily by flame hydrolysis. At Corning we have been manufacturing a zero-expansion version of this material, termed ultralow-expansion (ULE) glass, primarily for ground- and space-based telescope systems since the 1960s. In that time we have amassed much technological knowledge specific to this material. A new challenge is to tailor ULE glass composition and properties to meet the new set of requirements for EUVL applications. Current efforts have resulted in reduction of inclusion and striae levels as well as improved CTE metrology capabilities. Previous work on ULE glass includes modeling predictions for EUV optics, thermal-hysteresis behavior, delayed elasticity, temporal stability, and polishability.
Glass polishing considerations
Extreme UV optics and photomask substrates require a high spatial-frequency roughness (HSFR) of less than 0.15-nm root mean square (rms); several finishers have polished ULE glass to levels below this value. Fused silica can be polished slightly better than ULE glass, as evidenced by a side-by-side comparison that shows ULE glass with a HSFR of 0.13-nm rms vs. fused silica's of less than 0.08-nm rms. Made mostly of fused silica, ULE glass contains about 7% TiO2.
A study of differences in surface chemistry for ULE glass and 100% SiO2 glass suggests potential differences in polishing behavior for neutral and basic polishing slurries. Titration results for flame-hydrolysis-derived powders with identical compositions to ULE glass (93% SiO2 and 7% TiO2) and 100% SiO2 glasses suggest different solubility behaviors. The intrinsic pKa2 value (the point at which the concentrations of the ionized and un-ionized bases are equal) for the ULE glass composition powder was found to be 5.0 ±0.2, showing that ULE glass surfaces dissociate in water above pH 5 and are susceptible to dissolution. In comparison, the intrinsic pKa2 value for the 100% SiO2 powder was found to be 7.0 ±0.1, thus yielding a greater pH range for which 100% SiO2 is nonsoluble. These results suggest different polishing behavior when using slurries adjusted above pH 5.
Thermal expansion
The CTE in ULE glass can be measured by a number of techniques such as the sandwich-seal test or precision dilatometry, both of which are destructive in nature. It is, however, desirable to measure the CTE in glass samples with a nondestructive method that still maintains a high level of accuracy. No commercial method currently exists that can quickly measure the CTE directly to the high levels of accuracy and precision required for EUVL. A technique developed at Corning in the early 1970s, however, correlates the CTE of a titania-doped silica glass sample to its measured ultrasonic velocity.
Currently, precision levels of ±0.4 × 10⁻⁹/K at one standard deviation in a 100-mm path length are achieved with existing ultrasonic techniques. Equipment has been specified that is expected to improve the precision to ±0.2 × 10⁻⁹/K in 2003 and eventually to ±0.1 × 10⁻⁹/K in 2004. Still, this measurement accuracy depends on the accuracy of the ultrasonic velocity vs. CTE correlation, which in turn relies on the accuracy of an absolute CTE measurement. Efforts are in place at Corning Tropel (Fairport, NY) to improve the absolute CTE measurement. These efforts are on schedule to be online in 2003 with an accuracy of 1 × 10⁻⁹/K.
Striae
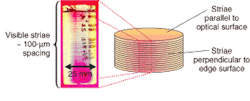
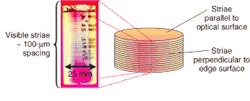
The striae in ULE glass can be reduced. The standard procedure is to have the optical surface parallel to the direction of the striae to minimize any impact striae may have on the part. An evaluation procedure based on a worst-case scenario examines glass that is cut perpendicular to the striae; this worst-case scenario allows for the best method of monitoring the impact of process changes on the striae within the glass (see Fig. 1).
Striae have traditionally been measured by shadowgraphs or with the naked eye. The demands of EUVL optical systems have required development of metrology techniques far more sensitive and quantitative. A microprobe technique is used to measure the titania variations within the striae; these variations are then converted to thermal expansion variations. By using the microprobe to take measurements perpendicular to the striae, an average 8 × 10⁻⁹/K peak-to-valley variation was found. These thermal-expansion differences between striae layers suggest the possibility of affecting the surface roughness of the polished part. However, models of the physical displacements from the thermal expansion variations within the striae show no effect on roughness.2
The microprobe has the spatial resolution and precision necessary to help provide a fundamental understanding of the cause of the striae. But sample-size limitations, as well as sample preparation and feedback time, impedes the improvement process. One of the better techniques of striae evaluation is based on a polarimeter. The thermal-expansion variations within the striae result in residual room-temperature stresses between the striae layers.
By using a polarimeter to examine these residual stresses and the microprobe to measure titania variations, a correlation was established between optical retardation and the titania variations. This indicates that either technique can be used to evaluate the striae. However, the polarimeter technique was found to be more robust and is therefore used to evaluate the impact of process changes on striae reduction.
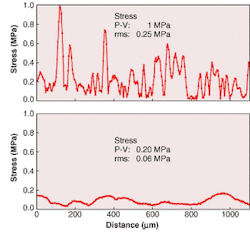
The fundamental cause of striae has been shown to be the result of small compositional variations that occur during the glass-forming operation. By adjusting the process, these variations can be reduced and the striae levels minimized. The stresses between layers of standard ULE glass can be compared to that of an improved EUVL-grade ULE glass (see Fig. 2). The stress is approximately four times smaller in this preliminary process. Further improvements are being implemented.
Inclusions
In the past, ULE glass applications did not require stringent inclusion specifications. Current EUVL requirements specify zero allowable defects (defined as 50-nm or larger sleeks, scratches, or other flaws) on the reflective surface. Traditional methods of inclusion inspection, which use microscopes and high-intensity light, are limited to a 50-µm inclusion-detection limit. Corning has developed a method that uses a helium neon laser to highlight inclusions 1 µm or larger in size.
By using this tool to track process improvements, a significant reduction in bulk inclusions has been achieved. During 2001, overall inclusions greater then 1 µm were reduced by a factor of 25 and inclusions greater than 80 µm were reduced by a factor of 10. Continuing process improvements to reduce inclusions are being implemented. In addition, improved inspection techniques are being reviewed.
ULE glass is being enhanced to meet the demands of the EUVL market. Many of the metrology tools necessary to quantify and evaluate process improvements have been put in place, including ultrasonic CTE metrology, XRF, microprobe, and polarimeter. Other metrology methods such as absolute CTE efforts that address CTE measurement accuracy will be implemented. New ultrasonic equipment has been designed to improve spatial resolution from 6 to 3 mm and precision from ±0.4 to ±0.1 ppb/K. The microprobe and polarimeter have facilitated a 4× improvement in striae. A bulk-glass laser inspection instrument improved inspection detection capabilities from 80 mm in size down to 1 mm in size and enabled significant improvements in inclusion reduction.
BRADFORD ACKERMAN is manager, advanced lithography; CHRISTINE HECKLE is manager, semiconductor materials development; KENNETH HRDINA and ROBERT SABIA are senior scientists, semiconductor materials development; and DAVID NAVAN is product engineer, semiconductor materials at Corning Incorporated, One Riverfront Plaza, Corning, NY 14831; e-mail Elijah Baity, market analyst, at [email protected].