How to measure losses in multiple-channel systems
How to measure losses in multiple-channel systems
Richard Buerli
Optical return loss in components, cables, and DWDM systems can be measured by various techniques--each has limitations and strengths.
In the past, the only measurement of importance in testing the performance of optical components and optical trunks was insertion loss--essentially the leakage of light energy due to fiber misalignment and other factors. Today, esoteric measurements such as polarization-dependent loss, return loss, and other formerly obscure performance parameters are of great importance to anyone working in the field of fiberoptic communications.
Each of these parameters, if not carefully qualified, is likely to impair the performance of a fiberoptic system and will ultimately reduce the transmission capacity of the network. Insertion loss introduced by optical components affects the loss budget of the system. Polarization dependence causes polarization-mode dispersion, which degrades the transmission speed of the network. And, reflections caused by system components can shift the operating wavelength of a transmitter and introduce noise, known as return loss. To make the laborious process of measuring insertion loss and return loss (reflectivity) more efficient, several automated systems have been designed that allow the testing of multiple devices.
Return loss defined
Reflections--or more specifically Fresnel reflections--occur at the boundary between two media with different refractive indices. The percentage of the light reflected can be calculated if the refractive indices of both media are known.
The most commonly known percentage of reflected power, the 4% reflection, is caused by a glass-to-air boundary. Reflectance in general is the ratio of reflected power to incident power. When knowledge of a reflection at a discrete point is important, the term reflectance is preferred. Reflectance is expressed in negative decibels (dB).
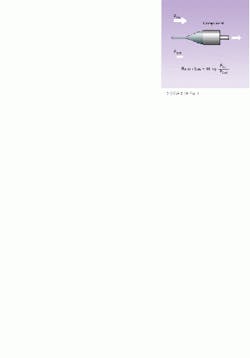
Optical return loss (ORL), often referred to as return loss, describes the ratio of reflected power over the incident power of a system as a whole. Similar in concept to reflectance, return loss is also expressed in decibels.
The basic method of measuring reflectance or return loss is to launch a known power level of light energy into a system or component and find some means of measuring the reflected power. If all the reflected power of a system is related to the launched power, it is referred to as system return loss. Certain return-loss measurement schemes, such as the continuous-wave method, measure only the system return loss.
Measuring the return loss of a discrete component, such as an in-line attenuator, is important for the qualification of that particular device. Measurement methods based on a reflectometer principle are geared toward resolving the issue of component return loss or, under some circumstances, the reflectivity of individual media transitions (see Fig. 1).
Optical continuous-wave reflectometry
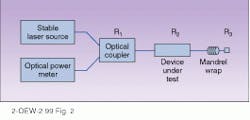
The most widely used method of return-loss measurement is optical continuous-wave reflectometry (OCWR). In this method, a continuous wavelength of light energy is passed through an interface, connector, or device under test. The returned power is measured and the return loss calculated. Using only a calibrated light source, coupler, and an optical power meter, return-loss measurements using OCWR can be accomplished with accuracy (see Fig. 2).
The absolute accuracy of an OCWR instrument depends on the insertion loss and reflectivity of the components in the return-loss path such as the optical coupler, bulkheads, couplings, and patch cords. To perform accurate return-loss measurements, two calibration steps are necessary--the instrument must be calibrated against a known reflection, and the background return loss must be measured.
A clean and polished PC-terminated connector left open to the air results in a very accurate 4% reflection. This measurement is equivalent to a 14.7-dB return loss, if it is assumed that the refractive index of the fiber is 1.45.
To calibrate an OCWR instrument for absolute measurements, a PC-terminated reference cable is connected. The reflected power level is then measured and logged as a reference. Subsequent measurement of devices under test are related to this absolute reference.
Background reflection and return loss
All components in a return-loss measurement path contribute to the reflected power. This parasitic reflected power is known as background reflection. To measure components or systems with high return loss (low reflectance) using an OCWR setup, the background return loss--the reflected power level caused by components other than the device under test--must be determined beforehand and subtracted from the actual measurement.
Background return loss is measured without a device under test connected to the OCWR setup. The end of the fiber that connects the OCWR setup to the device under test must be properly terminated so that it eliminates all reflections that could affect the baseline measurement. This setup can be accomplished with either a dedicated termination plug or a mandrel wrap (coiling the fiber several times around a hexagonal rod) or by applying an index-matching oil or gel at the end of the fiber.
After logging the background-reflected power of the OCWR setup, the subsequent measurement of the device under test can be corrected for background return loss. Assuming that the launched power is stable to within 0.1 dB, return-loss measurements can be performed within the accuracy range of the optical power meter.
OTDR method
The optical time-domain reflectometer (OTDR) launches light pulses into the device under test and collects backscatter information as well as superimposed Fresnel reflections. The OTDR is optimized to accurately measure loss per distance based on the received backscatter level. An OTDR also estimates the strength of a reflection at a given distance based on its peak height.
Like the OCWR device, the OTDR can be calibrated using an open PC termination. Because an OTDR is tuned to measure backscatter signals, which requires much greater sensitivity, such a calibration is not always possible.
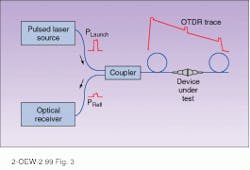
A more common method is to calibrate the OTDR to a known level of backscatter signal and then calculate the reflection peak in relation to it. Such a calibration is usually conducted by the manufacturer of the instrument, and calculation of the return loss is accomplished by software embedded in the instrument (see Fig. 3).
ORD method
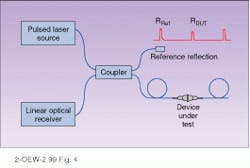
An optical-reflection-discrimination (ORD) instrument is based on the optical reflectometer method. Much like the OTDR, the ORD instrument launches a train of pulses. The reflected pulses are guided through the coupler to the optical receiver, amplified, and then sampled. A time-discrimination process allows the setup to isolate and quantify individual re flections.
Because the optical receiver is highly linear, the amplitude of the reflections is directly proportional to the reflect ivity and thus the return loss. Where as the conventional OTDR is optimized to measure backscatter signal, the ORD device is optimized to measure reflections.
Like the OCWR-based instruments, the ORD instrument can be calibrated using an open PC connector that causes a 4% reflection. It is also feasible to actually build the reference reflection into the ORD device by terminating the fourth port of the coupler with a PC-polished connector (see Fig. 4).
Both the ORD instrument and the OTDR discriminate reflections against elapsed time. Neither instrument registers background reflections. This lack of sensitivity to background reflections is an advantage when conducting multiple-channel measurements. Optical components in the measuring path, such as couplers and switches, do not influence the measurement.
When measuring insertion loss and return loss on many devices simultaneously, an obvious approach is to simply install multiple computer-controlled single-component instruments in a single cabinet. This approach offers an efficient way of acquiring the necessary component parameters. Unfortunately, it is also the most costly.
Optical switches are often used to conveniently multiplex light sources, return-loss meters, and power meters. Two popular methods devised to perform accurate multiple-channel insertion-loss measurements rely on optical switches.
In the first, considered the most accurate method, a switch multiplexes the light energy from a single source to each channel. The power level is then measured by an individual power meter dedicated to each channel. The absolute reference power, as well as the insertion loss, is measured directly from the end face of the devices under test.
In the second method, a single light source and a single optical power meter are multiplexed using two optical switches. To eliminate inaccuracies caused by differences in individual connectors (connector repeatability), the devices under test must be spliced in-line after the reference power measurement has been taken. This method is known as the cutback method and assumes that the splices do not add significantly to the insertion loss.
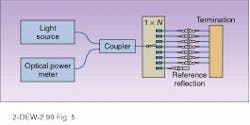
Optical switches are also used to multiplex the measuring path when conducting return-loss measurements. One advantage of a switched return-loss setup is that one channel can be connected to a known reference reflection (see Fig. 5).
When measuring multiple-channel return loss using a switched setup, careful consideration must be given to the fact that reflections caused by the far end of the setup will add to the background return loss of the system. Additional components in the measuring path, such as the optical switch, connector interfaces, and patchcords, will add reflections and increase the inherent reflected power and, thus, background return loss. Additional components in the measuring path also will add to the insertion loss. In addition, the fiber itself causes return loss due to backscattering.
During installation or after each reconfiguration, each channel must be carefully calibrated, which results in extremely long setup times. A software-guided procedure can help direct the operator through the calibration and automatically log the reference data.
OCWR-based multiple-channel setup
When specifying a multiple-channel insertion-loss and return-loss measurement system based on OCWR, high-grade optical components are called for. Special care must be taken where the light path meets the detector. For accurate measurement of the return loss, a proper termination of the far end of the device under test is also essential.
For accurate insertion- and return-loss measurements on short cable runs, as found in multiple-channel setups, OTDR is not a preferred method. However, the ORD instrument is specifically designed for such multiple-channel measurements.
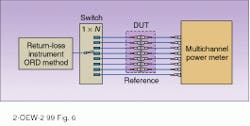
Like the OCWR instrument, the ORD device contains a stable laser source for the insertion-loss measurement. The absolute power level is referenced for each channel before the devices under test are inserted. For long-term testing, a dedicated reference channel monitors the stability of the light source (see Fig. 6).
The ORD method permits isolation of the reflections caused by the devices under test from all other reflections in the measurement path. This arrangement has the advantage that no termination is needed at the far end of the devices under test. In addition, background reflections do not affect the measurement accuracy or range. This eliminates the need for high-grade optical components and relaxes the performance requirements of the switch.
Each of the methods of return-loss measurement has its limitations. The advantage of the ORD method is that reflections are directly measured by sampling the reflections from the device under test, without being contaminated by background return loss. The measurement capability is not limited by cable length, the grade of the optical switch, or the termination of the cabling. When coupled with application software that guides the user through the calibration process and logs and processes the data acquired, the ORD method offers many advantages for component qualification, cable testing, and dense wavelength-division multiplexing system testing. o
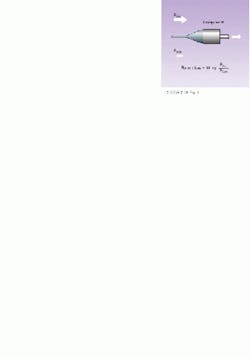
FIGURE 1. Optical return loss, expressed in decibels, is the ratio of reflected power over the incident power of a system as a whole.
FIGURE 2. Optical continuous-wave reflectometry measures the returned power from a stable laser source after it passes through a device under test.
FIGURE 3. An optical time-domain reflectometer tests and collects backscatter information and Fresnel reflections. This method accurately measures loss per distance and the strength of reflection at a given distance.
FIGURE 4. An optical-reflection-discrimination instrument guides reflected pulses through a coupler to an optical receiver, where individual reflections are isolated and quantified.
FIGURE 5. Incorporating optical switches into an optical time-domain reflectometer or optical-reflection-discrimination measurement system allows the measuring path to be multiplexed.
FIGURE 6. In a multiple-channel optical continuous-wave reflectometry arrangement, an optical-reflection-discrimination instrument can provide isolation of the reflections caused by the devices under test from other reflections in the measurement path.
