Optics Test & Measurement: Leveraging geometrical and physical optics in effective-focal-length measurement
PATRICK J. REARDON
At UAH-CAO, we are often asked to measure the performance of optical systems and components. Oftentimes, these requests are to provide an unbiased measurement of a commercial or custom optic, including throughput, image quality, aberrations, and even the basic paraxial properties. And although interferometry can provide very accurate measurements of the transmitted wavefront quality of an optical system, there are times when broad spectral measurements are required or the parameter desired is more basic and fundamental to the optic, such as the effective focal length (EFL).
As a university with both undergraduate and graduate degrees in optics, it is instructive to show students how their academic training can be practical in the real world. To illustrate, we present two different approaches for measuring the EFL of a lens system. The first is a classic geometrical optics-based metrology technique—the T-bar nodal slide test. The second approach is physical optics-based, using diffraction from a simple binary grating.
Geometrical optics: the nodal slide
First, a clarification is in order. In addition to measuring the imaging quality of a lens over its field of view, the T-bar nodal slide test can be used to measure the most basic paraxial parameter of an optical system—the EFL. However, the recent explosion in panoramic imaging systems has ushered in a new meaning for the "nodal slide."
For panoramic imaging, the rotations of the camera between images should be made about the entrance pupil of the camera to eliminate any parallax, as this creates problems for the panoramic stitching software. This is not the definition (or purpose) of the T-bar nodal slide discussed here. Instead, the position of the entrance pupil of the optic is unimportant, other than it being well within the test beam limits.
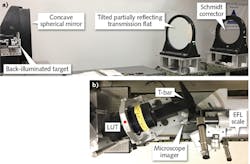
The T-bar nodal slide test requires two components: a collimator and the T-bar nodal slide (see Fig. 1). A collimator is simply an optical system with positive power, negligible aberration, and a radiant source at its front focal plane, making the target appear to be infinitely far away. The collimator can be reflective or refractive or, like the collimator at UAH-CAO, catadioptric. The collimated object can be a point source or an illuminated 2D transmissive target, and the source can be narrow or broadband, encompassing lasers, LEDs, or thermal sources that can be spectrally filtered. Thus, the T-bar nodal slide test can measure the performance of an optic over the same spectral band at which it will be used.
Operating the T-bar nodal slide requires positioning the rear nodal point of the lens under test (LUT) over the rotation axis of the T-bar nodal slide. This will, in a well-built system, result in the EFL of the lens being accurately determined.
But first, a brief foray into paraxial optics. The nodal points, like principal points and focal points, are fundamental locations in an optical system. For a lens in air, the nodal points and the principal points are identical. Simplifying to thin lenses and paraxial optics, a positive power lens of zero thickness will bring incident collimated light, propagating nominally in the +z direction, to focus on the rear focal plane, which is pierced by the optical axis at the rear focal point. The front focal plane and point are similarly defined, but by tracing the incident collimated light traveling in the -z direction.
The EFL of this thin lens is given as the distance from the lens vertex to the back focal point, and as it is positive in z, it is a positive-powered lens. For the thin lens in air, the front and rear nodal and principal points are located at the lens. Specifically, it is from them that the EFL is measured, not the location of the thin lens.
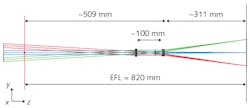
Given a thick lens in air, or a lens system consisting of several optical elements, the importance of the nodal points becomes more evident. For example, a telephoto lens system can have a long EFL (820 mm), but in a relatively short overall length with a back focal point only 311 mm from the last element surface (see Fig. 2).Since the rear nodal point is 820 mm from the rear focal point, then by definition, it must be located 820-311 = 509 mm to the left of the last surface. Since the lenses are only separated by approximately 100 mm, this means the rear nodal point is about 400 mm to the left of the first lens of the system. As a result, we see that the nodal points can be located nearly anywhere. But regardless of where they are located, it is from this point that the rear focal point, and therefore the rear focal plane, is defined.
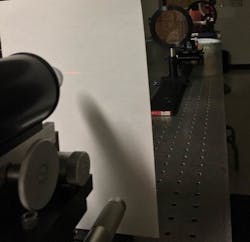
With a well-corrected or paraxial lens, the image for all fields of view falls on a flat plane—the paraxial image plane. Conversely, if a single collimated beam was incident on the lens, then—regardless of the tip or tilt of the lens—the image would always fall on the paraxial image plane. If the lens is rotated about the nodal point, the image will change in z as measured from the nodal point because the image surface is flat, but the image does not laterally translate (see Fig. 3). This is the basis of the T-bar nodal slide.At UAH, we use an EFL = 4.267 m, 406-mm-diameter Fecker Schmidt collimator. The target, attached to the primary mirror mount, holds one of many back-illuminated targets or a single-mode fiber coupled to a laser to provide a point source. The source light propagates to a partially reflecting optical flat that sends the light back to the spherical primary mirror, where it is collimated. The light now passes through the partially reflecting flat, but since the mirror is spherical, the light is spherically aberrated. Finally, the light passes through a Schmidt corrector plate that corrects the spherical aberration, presenting the optic with a well-corrected and collimated target beam.
Operating at about f/10.5, the limiting spatial resolution at the target is approximately 1/(10.5λ), or at λ = 550 nm, around 170 cy/mm, corresponding to an angular resolution of about 740 cy/mrad.
The LUT is mounted to the David Mann T-bar nodal slide. It has a microscope viewer with four different powered objectives—the result is one of the first demonstrations of an automatically self-correcting adaptive LSM. The T-bar, which is mounted to the LUT via a focus-adjusting stage, sets the image plane at which the microscope objectives sit. At its simplest, it is set by adjusting the microscope viewer to show the sharpest image to the operator. Alternatively, the eyepiece can be replaced by a system that computes modulation transfer function (MTF) or Strehl ratio.
Once the focus is set, placing the T-bar at the proper location, the LUT/T-bar system is rotated as the image is monitored through the microscopic viewer. If the rear nodal point of the LUT is not over the rotation point, the image moves as the LUT is rotated. If the nodal point is too close to the microscopic viewer, the image moves the opposite direction as the rear of the LUT.
If the nodal point is closer to the collimated source, the image moves the same direction as the rear of the LUT. This assists the user in adjusting the LUT position with respect to the rotation axis to quickly find the position for no image motion. As the focus is set and now the rear nodal point is properly positioned, the EFL can be read off a scale that indicates distance from the nodal point (which is the distance from the rotation axis). On the system at UAH, the scale has markings at 0.01 mm resolution.
As an example, a commercial 35 mm film camera lens with a nominal focal length of 200 mm was measured for a project that required precise knowledge of the EFL. The lens was adjustable to achieve focus from infinity to approximately 2 m. The adjustment did not just move the lenses as a group with respect to the sensor plane, but also moved lenses with respect to each other as with a zoom lens. It was therefore expected that the EFL would change with focus adjustment. Indeed, the infinity-focused EFL was 3% short of the catalog value, and when set to close focus, the EFL was nearly 10% shorter than the catalog value. Providing the customer EFL data for a range of focus positions enabled them to set the EFL to a specific value of their choice to within better than 1% error.
Positive and negative lenses
The preceding discussions have assumed that the LUT was a positive-powered lens. Testing a negative-powered lens requires a known-positive-powered lens and a mount that will hold the two elements, but also allows for a variable separation between the elements. The focal length of two separated lenses can be calculated using the following familiar equation:
Here, t is the air space between the rear and front nodal points of the front and rear lens, respectively. However, although the T-bar nodal slide uses the position of the nodal points to measure the lens focal length, the precise position of the nodal point in the previously measured positive lens is not readily marked, and it is certainly not known for the negative-powered lens.
For a single measurement of the assembled positive and negative lenses, t and EFL- are both unknowns. If the separation is changed and a second system EFL measurement is taken, then solving both configurations for t yields:
When combined, you can solve for EFL- as:
Thus, the power of the negative lens can be computed knowing the focal length of the positive lens, the change in separation between the positive and the negative power LUT, and the system EFL measured in the two cases.
It should be apparent that the T-bar nodal slide test can be performed at many narrow spectral bands, such as the F, d, and C wavelengths (486.13 nm, 587.56 nm, and 656.27 nm, respectively). In this way, the Abbe number of a singlet of unknown material can be determined. And if the radii and thickness are known, the refractive index can be determined; in fact, this process was used at UAH-CAO to determine which glass types were used in a cemented doublet after the doublet was separated into individual elements.
Physical optics: a diffraction grating
A second method for testing the EFL of a lens system still requires a collimator, but the nodal slide is replaced with a low-spatial-frequency multi-order diffraction grating. The grating is a binary amplitude linear Ronchi grating of period Λp—a series of clear and opaque lines of equal width Λp/2—on a transmission flat with negligible transmitted wavefront error.
From basic Fourier optics, one finds that a normally incident collimated beam of wavelength λ will diffract into a fan of collimated beams at the following angles, where m is the diffracted order:
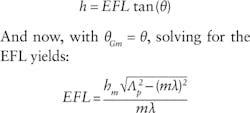
The grating should be placed in the collimated beam in front of the LUT to illuminate the lens with precisely angularly separated plane waves. Since the incident light is still plane waves, it will come to focus in the LUT focal plane and the focal length can be determined by observing this array of spots. The image height, h, given an incident collimated beam of light at angle θ, is calculated as follows:
At UAH-CAO, an interferometer operating at 632.82 nm was used as the collimator. The grating had a period of 0.254 mm (100 lp/in.), so the first-order diffracted angles are 2.49 mrad or 0.143 degrees, which for this system were sufficiently small to have negligible distortion.
Depending on the LUT, the spot separations can be measured by placing a detector array in the focal plane, recording the spot images, and computing their separation based on the pixel separation. One system tested produced point-spread functions (PSFs) too small to reliably determine the location of the spot centroids, so a microscope objective was attached to the detector to magnify the spots. This magnified detector assembly was translated on a precision linear stage to physically move each spot into the same location on the detector array to read spot separation off the translation stage. This removed the need to know the exact magnification of the microscope objective.
Since the LUT is already in front of an interferometer, the aberrations of the system can also be quantified. Therefore, if field-dependent aberrations arise, the EFL can be computed based on either the centroids of the PSFs or the location of the chief ray. As a result, the performance of an optic relative to its designed behavior can be directly compared.
Depending on the availability of equipment, these two methods can be used for in-lab EFL verification. The more appropriate choice will be guided not only by the available equipment, but also by the requirements of the system, such as the tolerances and the spectral band.
Patrick J. Reardon is assistant professor of Electrical & Computer Engineering and associate director of the Center for Applied Optics at the University of Alabama in Huntsville (UAH-CAO), Huntsville, AL; e-mail: [email protected]; http://www.uah.edu/cao.


![FIGURE 3. A lens is rotated about an arbitrary point at its left end (a), and about its rear nodal point [red dot] (b). The black axes are aligned to the collimated input beam and fixed to the rotation point. The flat image plane, solid green, and its relation to the lens is noted by the dashed green line that forms the 'T.' FIGURE 3. A lens is rotated about an arbitrary point at its left end (a), and about its rear nodal point [red dot] (b). The black axes are aligned to the collimated input beam and fixed to the rotation point. The flat image plane, solid green, and its relation to the lens is noted by the dashed green line that forms the 'T.'](https://img.laserfocusworld.com/files/base/ebm/lfw/image/2019/01/content_dam_lfw_print_articles_2016_12_1612lfw_rea_f3.png?auto=format,compress&fit=max&q=45?w=250&width=250)


