The double-slit experiment devised by Thomas Young exactly two centuries ago to prove that light is a wave is still sometimes used to measure the spatial coherence of light sources. Now, researchers at JILA (Boulder, CO) are using the configuration (with pinholes rather than slits) to measure both the wavelength and spectrum of an extreme-ultraviolet (EUV) light source.1 They claim that this is the first use of Young's double-slit configuration to measure the spectral properties of a nonmonochromatic source at any wavelength. The technique would be especially useful in the EUV, where the difficulty of making optical systems perform well makes simplicity the key.
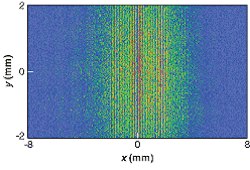
For test, the researchers created an EUV source by focusing 27-fs pulses from a Ti:sapphire laser into a 10-cm-long 150-μm-diameter hollow-core fiber filled with argon gas. The light was produced by the high-harmonic generation process, phase-matched and peaked at the 21st harmonic. With the infrared laser beam filtered out, the EUV light was passed through two 20-μm-diameter pinholes placed 574.6 μm apart. An EUV-sensitive charge-coupled-device camera a distance of 2.85 m from the pinholes was exposed to the radiation for 60 s, producing the interference pattern shown here in false color.
A one-dimensional Fourier transform of the pattern's profile contained sidebands revealing the optical frequency spectrum of the EUV light; the spectral profile showed four closely spaced harmonic peaks, with the highest being the 21st harmonic of 38 nm. The spectrum was compared with that taken by an imaging EUV spectrometer; when the spectrometer data were convolved with the pinhole resolution, the measured and calculated widths of the harmonic lines matched to within 10%. Observed differences in peak heights between the two measurement methods were attributed to spectral variations in the spectrometer response.
REFERENCE
1. R. A. Bartels et al., Opt. Lett. 27(9), 707 (May 1, 2002).
About the Author
John Wallace
Senior Technical Editor (1998-2022)
John Wallace was with Laser Focus World for nearly 25 years, retiring in late June 2022. He obtained a bachelor's degree in mechanical engineering and physics at Rutgers University and a master's in optical engineering at the University of Rochester. Before becoming an editor, John worked as an engineer at RCA, Exxon, Eastman Kodak, and GCA Corporation.
