Speckle techniques map deformation and displacement
Laser speckle, the graininess that is perceived or recorded photographically when an object is illuminated by coherent light, was, for many years, viewed as a fundamental limitation to the use of lasers in many applications. For example, experimental high-brightness projectors that use visible-light-emitting lasers instead of arc lamps must include hardware for the reduction or elimination of speckle in the projected image. Speckle is not all bad, however, because the details of the pattern produced by a coherently illuminated object are uniquely related to its surface features. As a result, speckle-based techniques can be used for high-resolution mapping of displacement, strain, and motion.
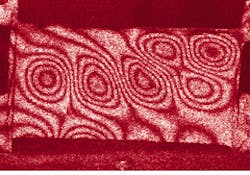
‘Speckle’ is produced by microscopic surface variations on the scale of a single optical wavelength that result in phase variations in the reflected light. When dephased waves originating from different regions of an object are combined on the retina, photographic film, or other recording medium, a granular interference is produced. In the most dramatic case, this pattern has a 100% modulation function and an average grain size that is determined by the wavelength of the light and the optical system used to view it.
While a single speckle pattern provides little information on the scattering object, changes in the pattern are quantitatively related to surface translation. Thus, by comparing the speckle pattern produced by an object in two separate states, it is possible to map changes in surface contour due to stress or motion. Speckle interferometry describes the two-step process of generating such a map.
In speckle photography, a double exposure records the speckle pattern produced by the object in two separate states. Optical processing of this ‘specklegram’ produces a final interferogram with contours that can be used to determine surface displacement. In speckle-correlation interferometry and electronic speckle-pattern interferometry (ESPI), a reference beam is incident on the recording medium, and the specklegram is produced by interference between the speckle pattern from the object and the reference beam. Comparison between two specklegrams of the object recorded in this way provide a highly sensitive map of out-of-plane displacements that is similar, in many ways, to a holographic interferogram (see Laser Focus World, March 1998, p. 107).
Coherent illumination generates speckle
When any object that is not an ideal specular reflector is illuminated with a coherent beam, microscopic variations in the surface randomly dephase the scattered and reflected light. When this light is imaged onto a surface (the retina of the eye or a photographic plate, for example), interference between dephased components produces a random fluctuation in amplitude known as speckle.
From a nondestructive testing (NDT) standpoint, two features of the speckle phenomena are important. First, and most important, the amplitude pattern on the image plane is uniquely correlated to the surface features of the illuminated object. For small displacements in the plane perpendicular to the viewing direction (in-plane motion), the pattern is ‘anchored’ to the object, moving with it as it is stressed or deformed. Orthogonal to this plane, the speckles are stretched out, making them relatively insensitive to out-of-plane motion.
The other key property of the speckle phenomena is that, for most samples of interest, the size distribution of the speckles on the image plane is determined by the optical system and the illumination wavelength, not by sample features. Thus, it is possible to optically adjust the speckle size to match the pixel size of a solid-state detector or achieve a desired resolution. For a system that magnifies the object by a factor M on the image plane and has an f-number f, the average size of a speckle grain on the image surface is given by
Average speckle size = 1.22 (1 + M) l (f/M)
where l is the wavelength of illuminating source.1
Speckle photography measures motion
Because the speckle pattern is essentially anchored to the object as it is moved through small distances, in-plane motion can be quantified by comparing the speckle pattern at two instants in time. In a single-aperture speckle photography setup, this is accomplished by a double exposure of the photographic plate (see Fig. 1, top). After it is developed, the specklegram is found to consist of a large number of speckle pairs whose separation depends on the magnitude and direction of the in-plane sample motion between exposures.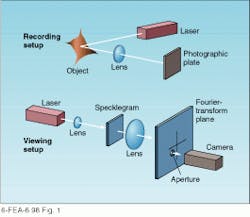
Translating this information into usable data on surface displacement is accomplished by using Fourier-transform techniques. One method for accomplishing this task is to illuminate the specklegram with a spatially filtered laser beam (see Fig. 1, bottom). A lens placed behind it is used to take the two-dimensional Fourier transform; a portion is viewed through an aperture located in the transform plane. In the transform plane, light passing through an aperture located at a vertical distance l from the origin of the produced speckle pairs is displaced in the same direction by distance p. Mathematically, this distance is related to the focal length F of the transform lens and the wavelength of the readout laser by the following equation
p = nFl/l
where n is an integer.1
A camera located behind the aperture performs an inverse transform and produces an image of the object that is modulated by displacement fringes. In practice, fringes corresponding to different displacement directions can be generated by changing the polar angle of the aperture, while the sensitivity of the method is dependent on its distance from the origin.
When compared to holographic techniques and phase-sensitive speckle interferometry, speckle photography is distinguished by reduced sensitivity to environmental vibrations. Independent measurements of displacement in two orthogonal directions can be made simultaneously using a single specklegram with a sensitivity that can be varied over a wide range. Chief drawbacks of the technique include poor sensitivity to out-of-plane displacement, complexity and expense of photographic processing, and degradation of fringe visibility by the speckle pattern.
Speckle correlation
In applications for which it is desirable to quantify out-of-plane displacement, a coherent reference beam is mixed with the speckle pattern in the image plane of the recording setup (see Fig. 2). Speckle-grams produced in this way are a record of both the phase and intensity variation of the object speckle and, as such, are sensitive to sub-wavelength motion in the out-of-plane direction. Speckle-correlation interferometry is a technique in which two specklegrams of an object are recorded under identical conditions and superimposed, giving rise to dark fringes that correlate with object displacement. In the geometry of Fig. 1, these fringes are produced at locations on the test object where the out-of-plane displacement is an integer multiple of l/(1 + cos q), and q is the angle of the illuminating beam.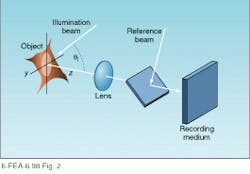
A comparison of speckle-correlation interferometry to holographic techniques shows them to be similar in many respects. In particular, they use recording setups that are qualitatively similar and have comparable resolutions. Key differences arise from the fact that a coherent reconstruction process is used to produce a holographic interferogram, while speckle-correlation fringes are produced by the incoherent addition of two speckle patterns. Stated differently, the fringes in a holographic interferogram are produced by the phase difference between two holograms, while those generated via speckle correlation are the result of the amplitude differences in two specklegrams.
From a practical standpoint, a high degree of vibration isolation (comparable to that needed to record a good hologram) is required during the recording process. The spatial-resolution requirements of the recording medium used for speckle correlation are, however, relaxed enough to permit the use of ordinary photographic film or a charge-coupled-device (CCD) array. Furthermore, the reconstruction process used for speckle correlation is basically an addition or subtraction of amplitudes that can be accomplished nonoptically.
Electronic speckle-pattern interferometry utilizes these properties to good advantage by electronically recording phase-sensitive specklegrams and using a computer or dedicated signal processor to add or subtract one pattern from another. In this way, real-time video images of the correlation fringe pattern are produced without photography or optical image processing. These features are highly desirable in real-world NDT applications, and setups similar to that shown in Fig. 3 are being used with increased frequency.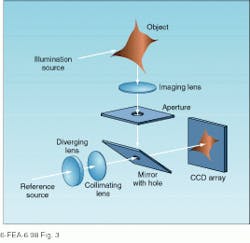
Alternative illumination schemes can be used to measure in-plane displacement and increase the physical displacement corresponding to a single fringe. In both cases, phase-sensitive specklegrams are produced by illuminating the test object from two directions and eliminating the reference beam shown in Figs. 2 and 3.
Fringe visibility in speckle-correlation interferometry is, in general, less than that obtained with other optical techniques due to the amplitude modulation of the pattern by speckle. This problem can be partially addressed, however, by using electronic signal processing in an ESPI setup. Electronic techniques are governed by their own set of resolution limits that ultimately stem from the spatial resolution of the detector. In cases where speckles are too small to be resolved by the detector, the information contained in the pattern is lost. As a result, the f-number of the imaging system must be decreased until individual speckles are large enough to be resolved. Furthermore, the fringe spacing must be several times larger than the average speckle size to facilitate reliable fringe counting.
These requirements place a maximum limit on the number of fringes that can be viewed in a single image and lead to increased illumination power requirements. In most applications, however, these limitations are more than compensated for by the speed of the technique and the fact that no film processing is required.
Compatibility with diode-based sources
While the total illuminating power required to record a specklegram is ultimately dependent on the size of the test object and the efficiency of the viewing system, sources with output powers in the 10- to 100-mW range are useful for a number of applications. In this power range, single-frequency diode lasers and diode-pumped solid-state lasers offer multiple advantages of coherence, size, and efficiency with respect to older gas-laser technology. Although cost and wavelength considerations still are an issue, manufacturers of speckle interferometers have already incorporated both semiconductor and diode-pumped solid-state lasers in their instruments. As the cost and reliability of solid-state sources continue to improve, it is reasonable to expect that they will be used with greater frequency in speckle-correlation instruments, resulting in improved performance and reliability.
Electronic speckle-pattern interferometry instruments will benefit directly from the development of higher-resolution CCD arrays and faster video-processing equipment. Progress in both of these areas should lead to the availability of real-time video systems with increasingly higher resolution.
Electronic speckle techniques offer a combination of properties that are highly attractive in the industrial setting. Their inherently high resolution combined with real-time video-output capability should make them the techniques of choice for a wide range of applications. Speckle photography and other film-based techniques will continue to find niche applications but do not appear to share ESPI’s potential for widespread application, due to the complexities of film processing and readout. Overall, speckle techniques are attractive alternatives to holographic interferometry in a wide range of NDT applications.
REFERENCE
1. G. Cloud, Optical Methods of Engineering Analysis, Cambridge Press, Cambridge, England (1995).