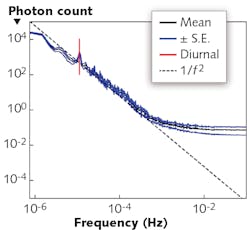
Photon-count fluctuations follow inverse-square behavior down to a microhertz
Light sources in general do not emit a precise and unchanging parade of photons; instead, photon-count fluctuations with a magnitude depending on fluctuation frequency is the norm. A group of researchers at Boston University (Boston, MA) has now measured the spectral behavior of this photon-count fluctuation to extremely low frequency levels of less than 1 µHz—which necessitated measurement durations of many days. The results show a 1/f2 spectral behavior over the frequency range of 1 × 10⁻⁶ to 5 × 10⁻⁴ Hz, which corresponds to a time “wavelength” of 33 minutes to 11.6 days. One of the most important features of the study is that the experiment was done using a variety of very different types of light emitters, including LEDs, superluminescent LEDs (SLEDs), laser diodes, incandescent lamps, and a betaluminescent source (a light source in which a phosphor is driven by beta emissions from tritium, a radioactive isotope of hydrogen). In all cases, the 1/f2 behavior was observed, which allowed the researchers to not only exhibit spectral plots of the behavior of individual emitters, but also to create a “metaplot” of an average of all the individual spectral behaviors (S. E. is standard error).
While most of the sources were operated at ambient temperature, the SLEDs and LEDs were thermoelectrically cooled, which also stabilized their temperature. All light sources were attenuated to an average photon flux of 200,000 photons per second in the experiment; the attenuated light was incident on a single-photon avalanche photodiode (SPAD) module that counted the individual photons. In a second experiment, done on a blue LED, the output light was split and sent to both a SPAD and a photomultiplier tube (PMT) to check that the results were not dependent on the type of photodetector. The experiment was carried on for a period of many days; one effect of this was that, due to incomplete isolation of outside light in the lab, a frequency “blip” at the diurnal period of one day was observed in the data. The researchers note that determining causes of the photon fluctuations is an important future task. Reference: N. Mohan, S. B. Lowen, and M. C. Teich, arXiv:1911.08466v1 [physics.optics] (Nov. 19, 2019).
About the Author
John Wallace
Senior Technical Editor (1998-2022)
John Wallace was with Laser Focus World for nearly 25 years, retiring in late June 2022. He obtained a bachelor's degree in mechanical engineering and physics at Rutgers University and a master's in optical engineering at the University of Rochester. Before becoming an editor, John worked as an engineer at RCA, Exxon, Eastman Kodak, and GCA Corporation.

