Understanding and Optimizing Processes: A Technical Look at Three Common CO2 Laser Processing Topics
SYNRAD, Inc. • 4600 Campus Place • Mukilteo, WA 98275 USA
tel 1.425.349.3500 • fax 1.425.349.3667 • toll-free 1.800.SYNRAD1
• e-mail [email protected] • www.synrad.com
CO2 Laser Marking Glass
This document is designed to provide some understanding of glass marking using a CO2 laser, but ultimately to successfully mark glass using a SYNRAD CO2 laser, FH Series marking head and WinMark Pro Laser Marking Software. Three glass marking methods are described in this document along with best starting point conditions and information to allow the end user to iterate towards the best possible mark.
Important Note: Instructions set out in this document are based on the default settings for WinMark Pro software and the use of a 48-2 (25 W) CO2 laser. The only settings provided are those that differ from WinMark Pro’s default property values. Because each laser has small differences in percentage power vs. actual output power, power settings are specified in watts.
Glass Types
One necessary aspect of glass marking using a CO2 laser is categorizing the type of glass to be marked:
Soda-lime glass
This is commercial-type glass whose primary characteristics include a low temperature softening point, around 400°C, and a relatively high coefficient of expansion. This glass, also referred to as float glass due to the manufacturing method, and can be tempered, chemically strengthened, or plain. Traditionally this has been the most difficult type of glass to laser mark; however, the methods described in this document actually take advantage of the glass’s properties to produce the laser mark.
Medium thermal-resistant glass
This category of glass has a medium softening point, around 800°C, and a medium coefficient of expansion. Typically used for light-duty, heat-resistant applications such as lab slides and some lens materials.
High thermal-resistant glass
High thermal-resistant glasses have a low expansion coefficient and high softening temperature, around 1000°C. These are high-performance glasses such as borosilicate, fused silica, and quartz.
Mark Types
The coefficient of expansion and softening point of a particular glass determines the type of controlled fracturing that is achieved using a CO2 laser. Three types of marks are described here: the Ring Fracture, Sandblast Fracture, and Stress Relieved mark. Soda-lime glass marks using all three methods, medium thermal-resistant glasses mark well using the Ring Fracture or Stress Relieved methods, High thermal-resistant glass marks well, with no fracturing, using the Stress Relieved technique.
Ring Fracture Marks
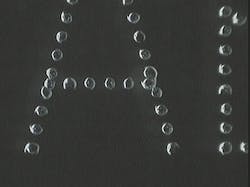
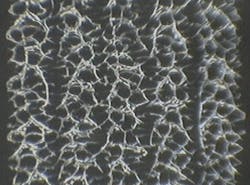
The ring fracture technique is based on WinMark Pro’s Spot Marking Style property and is effective in marking barcodes, 2D DataMatrix™ codes, and text. The ring fracture is best created using 80 mm, 125 mm, or 200 mm lenses. The 370 mm lens can be used to mark lower resolution text and larger DataMatrix codes. The magnified image in Figure 1 clearly shows the ring nature of the fracture.
WinMark Pro mark file setup
For all marks, the Spot Marking Style property must be selected and set to “Yes”. Barcodes are inverted (Barcode Inverted property = “Yes”), and for Data Matrix codes, the 2D Barcode Bitmap property must be set to “No”.
Modifying parameters
Key parameters for glass marking are Spot Mark Duration, Power, Velocity, and Resolution. The values shown in Table 1 below represent typical starting conditions; however, due to variations in glass and laser power curves, these specific parameters may not always produce the optimum mark so careful experimentation is usually required to ‘fine-tune’ marking results.
The size of the ring fracture is a function of the beam’s spot size and power input. Fracture diameters can range from 80% of the laser spot diameter up to almost twice the focused spot size. The depth of ring fractures is approximately the penetration depth of the laser, typically 30 to 60 microns using a 25 W laser and the conditions listed in Table 1. Fractures smaller than the focused spot are a result of the bell-shaped power density curve of the laser spot—more energy per unit area is delivered at the center of the laser spot than at the outer edge. The ring fracture requires a minimum energy density for formation, so ring fractures can be adjusted to fit your marking requirements through careful selection of focusing lens and Power settings.
| Lens / Mark Object | Power (W) | Velocity | Resolution | Number of Mark Passes | Spot Mark Duration (1/10 ms) |
80 mm lens | |||||
1D Barcode | 4 | 7 | 90 | 2 | 1 |
DataMatrix | 2 | 7 | 50 | 2 | 1 |
| Text | 4 | 6 | 300 | 3 | 8 |
| 125 mm lens | |||||
| 1D Barcode | 2 | 4 | 60 | 2 | 1 |
| DataMatrix | 2 | 4 | 50 | 2 | 1 |
| Text | 5 | 4 | 250 | 3 | 8 |
| 200 mm lens | |||||
| 1D Barcode | 5 | 5 | 50 | 2 | 1 |
| DataMatrix | 5 | 6 | 50 | 2 | 1 |
| Text | 9 | 6 | 230 | 3 | 8 |
370 mm lens | |||||
| DataMatrix | 25 | 5 | 50 | 2 | 25 |
| Text | 25 | 4 | 165 | 3 | 15 |
Table 1. Initial marking parameters
The three variables used for controlling energy input into the glass are: Power, Velocity, and Spot Mark Duration. All three properties are interrelated along with mark Resolution.
Power – Changing power is the easiest way to affect the spot size. The example settings given above provide ring fractures that form instantly after the laser passes; however, smaller fractures can be made using lower power levels that can take seconds or up 24 hours to form. A good method for making smaller fractures is to make the first pass with 2% to 4% less Power than the second pass. The first pass at a lower power level defines the area where the fracture will form and the second pass provides the energy required for fracture formation. The images in Figure 2 compare two DataMatrix codes made using a 125 mm lens with a 180-micron spot size. The image on the left was made using the property values described in Table 1, providing 300-micron ring fractures. The 2D code on the right was created using the same conditions except for a Velocity of 25”/s and 18% Power on the first pass and 20% Power on the second. These settings produced 200-micron ring fractures.
Velocity and Spot Mark Duration - Increasing mirror speeds (Velocity) provides marks with lower cycle times, but also increases the area where the laser energy is applied, because the mirror does not stop for each spot. When adjusting Velocity, the Spot Mark Duration must be taken into account. When the laser pulse length is short and theVelocity low, the spot formed is circular. Increasing speed will elongate the area lased giving an oval shape instead of a ring. 2D Data Matrix and 1D bar codes work well using a Spot Mark Duration of 1 (0.1 ms). Marking text works best with Spot Mark Durations of 3 or greater because of the Pline Start Delay and Pline End Delay properties associated with text characters.
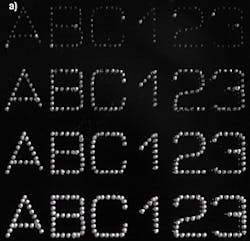
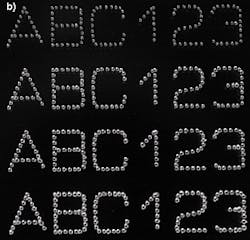
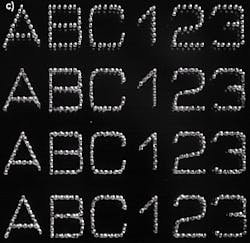
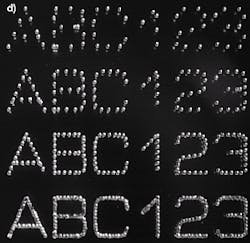
When changing Power, Velocity, and Spot Mark Duration properties, the Resolution must be adjusted as well. During laser marking, the stresses that will create ring fractures at the end of the mark build on the glass surface. If the laser spots are placed without enough separation, the stress is released by fracturing from spot to spot instead of within each individual spot. If Resolution is too high (spots very close together) then elongated fractures form that connect spot to spot. Spots separated by at least one-half the fracture radius work best.
Figure 3.The effect of the Power, Velocity, Spot Mark Duration and Resolution. (a) The effect of increasing Spot Mark Duration from 1, to 3, 5 and 8 (top to bottom), (b) The effect of Power changes from 2.5 W to 7 W, 11 W and 14 W, (c) The effect of Velocity changes from 10”/s to 20”/s, 30”/s and 40”/s, (d) The effect of Resolution changes from 150 to 200, 250 and 300 dots per inch. Constant settings were 3 Mark Passes, 7 W, 10”/s, Resolution of 250, and Spot Mark Duration of 8.
| Mark Parameter | Effect of Increasing Value | Effect of Decreasing Value |
| Power | Enlarge fracture size | Decrease fracture size |
| Spot Mark Duration | Enlarge fracture size, though fracture may elongate | Decrease fracture size |
| Velocity | Reduce fracture size, and possibly elongate fracture. | Increase fracture size |
| Resolution | Decrease spot spacing, ideally should be around ½ of spot radius. | Increase spot spacing, filled marks become difficult. |
Table 2. Ring fracture parameter summary
Sandblast Fracture Marks
Figure 4 - Sandblast fracture mark comprises a readable Code 128 linear barcode. The magnified image clearly shows the sandblast type nature of the fracture. The Code 128 barcode and the DataMatrix code were made with 15 W of Power using a 370 mm lens, 45”/s Velocity and 250 Resolution. The human-readable text string was marked using 18 W at a Velocity of 55”/s and 750 Resolution.
The idea of the sandblast mark is to produce a continuous fractured spot. The sandblast mark is best made using a large spot diameter that has a diffuse power distribution. The 370 mm lens provides a 520-micron spot and has a 20 mm depth of focus, which is the ideal lens to use in making the sandblast mark. Although 80 mm, 125 mm, or 200 mm lens can be defocused to provide a 520-micron spot size, the depth of focus for each lens applies even when out of the focal plane. The depth of focus for the 80 mm 125 mm and 200 mm lenses are 0.8 mm, 3 mm and 5 mm respectively.
Using the appropriate marking conditions, the CO2 laser will produce a stable “bubble” that protrudes from the surface of the glass during marking. This bubble has a lower density than the underlying material therefore setting up tensile forces pulling the bubble back towards the original surface. A slight amount of pressure forcing this low-density bubble back towards the surface is sufficient to cause the glass to fracture, as highlighted in Figure 5. The fracture will cascade along the low-density lines created by the marking process. These fractures are perpendicular to the bubble surface and extend only to the bottom of the low-density bubble into the glass; a depth around 30 to 50 microns. This type of mark produces vertical fractures so that no loose chips are formed.
It is important to note that this type of mark requires a uniform marking surface to produce stable bubbles that can be fractured. Therefore, the quality and repeatability of this method is sensitive to the surface condition of the glass. A pristine surface is optimal, with a scratched surface being worst because surface scratches tend to cause fractures to form while marking. Glass uniformity must also extend into the glass surface slightly beyond the penetration depth of the laser in order to produce even marking.
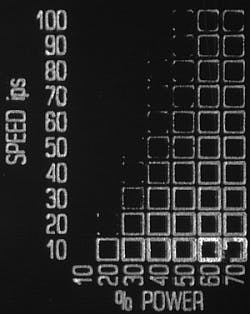
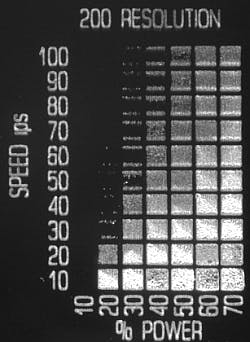
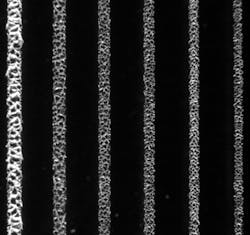
Power and speed settings are fairly flexible, Figure 6 shows filled and unfilled matrices produced using a 370 mm lens on soda lime float glass. As illustrated in these photos, there is a large central area where the mark is stable. If the power level is too low then intermittent marking occurs, and the formation of loose scale like chips occurs. Setting Power levels too high results in deep fracturing with heavy chip formation. Between these two extremes, the power input can be adjusted to provide the desired contrast and readability. Figure 7 shows how fracture size and density are affected by controlling power input through velocity variations. Naturally, power input is changed using WinMark Pro’s percent Power setting. Overlapping laser scans with high Resolution settings also increases power input into the glass.
Starting points for the sandblast mark:
370 mm lens | Power (W) | Velocity ("/s) | Resolution |
1D Barcode | 15 | 45 | 250 |
DataMatrix | 15 | 45 | 250 |
Text | 18 | 25 | 750 |
Stress-Relieved Marks
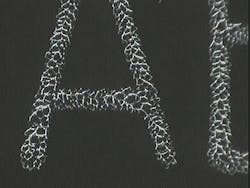
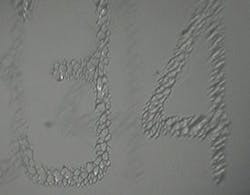
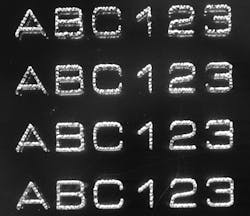
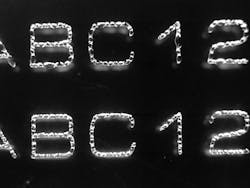
A stress-relieved mark is effective for marking all three of the glass categories listed in this document. The goal of this technique is to limit any random fractures that extend beyond the laser-marked characters by creating a stress gradient. By using multiple passes, the glass beyond the mark area is heated through conduction. This heated glass acts as a buffer between the hot laser-heated glass and the room-temperature material. As the glass cools, the stress of laser marking is spread evenly over an extended area. Figure 9 shows 1, 3, 6, and 12 pass marks. The resulting mark has chip formation similar to standard CO2 laser marking, but the tendency for fracturing beyond the intended area is greatly reduced.
Soda lime and some medium-duty heat-resistant glasses will usually fracture instantly, followed by secondary fracturing occurring seconds to hours later. The initial fracturing is perpendicular to the direction of laser movement and extends beyond the laser-heated area. These perpendicular fractures occur instantaneously. The perpendicular fractures then join by fracturing parallel to the direction of laser movement. The tendency of glass to form conical fractures causes these parallel fractures to form an extended series of “figure 8’s” instead of the desired lines.
The marks produced in Figures 9 and 10 were made using a 125 mm lens, a Velocity of 45"/s, and 18 W. The number of passes is selected using the Mark Passes option. Increasing the number of passes or increasing Power will produce marks with greater visibility and a deeper engraved depth.
Laser Polarization Effects in Metals, Ceramics, and Acrylics
Laser, or beam, polarization is a complex subject area when looking at exactly how and why it affects processing of metal, ceramic, and acrylic materials. However, as a simple effect, polarization is easily identified as cutting variations in different cut directions.
What is beam polarization?
Laser light is an electromagnetic wave containing both electric and magnetic components. The orientation of these components in relation to the beam's direction of travel is called polarization. Within the laser's beam, the electric vector contains the processing power. The electric vector's orientation and temporal stability (its variation over time) are key to processing metals and a number of dielectric materials.
In randomly polarized lasers, the beam's electric vector is rapidly changing orientation over time. Linearly polarized lasers have a fixed electric vector that extends in a fixed direction. When the beam's electric vector rotates uniformly in a circular pattern, it is said to have a circular polarization.
When is the polarization effect noticeable?
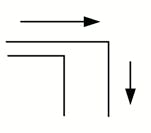
When a beam is circularly or randomly polarized, the electric vector that contains the laser power is orientated evenly in all cutting directions. Therefore, no effect can be seen. However, linear polarization means that the power (power absorption) is orientated in one fixed direction. Therefore, cutting in-line (parallel), at an angle, and perpendicular to this direction causes variations in cutting results.
Polarization effect in metals
The effects of using a linearly polarized beam in metals are:
- Variation in directional cut widths
- Reduced process stability
- Angled cut edges on curved cuts
Variation in orthogonal cut widths for a linearly polarized beam can be up to 30%. This is a result of the beam power being absorbed differently when the polarization is parallel versus perpendicular to the direction of travel.
This difference in cut widths reduces pattern resolution and increases dimensional tolerances. In addition to this effect, the stability of the process is reduced as changing a cut width tends to upset the cutting action. More generally, as a result of enhanced absorption the parallel direction of cutting is the fastest.
When cutting circles, there is a point where the cut path becomes angled to the directional of polarization, this causes an interesting outcome. At this point, the cut edge geometry changes from being square to tapered outward at the base of the cut. The result is that the topside of the cut is a circle; however, the underside is an ellipse. The angle of this taper is around 5 degrees, so the effect becomes more pronounced the thicker the material. For metal thicknesses under 0.04" thickness, this effect is fairly minimal.
Polarization effect in ceramics
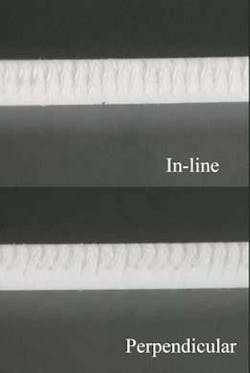
The dielectric nature of ceramic also produces polarization sensitivity. The key result is a difference in scribe depth when processing in-line (parallel) versus perpendicular to the direction of polarization.
The pictures below highlight the difference. Compared to processing with the polarization parallel to the scribe direction, scribing with the polarization perpendicular to the scribe direction causes a reduction in scribe depth and the tendency to produce the "hook" defect. Circular polarization offers mid ground—not as much penetration as parallel, but consistency in all directions without showing the hook defect.
Polarization effect in acrylic
When discussing polarization, acrylic is a surprise material. Generally acrylics (or most plastics, for that matter) are not sensitive to beam polarization; however, when cutting above certain thicknesses, acrylic does show direction dependency.
The effect is similar to the tapered edge produced in metal cutting. The effect in acrylic is a result of material waveguiding the laser beam. Multiple reflections of the beam within the cut width cause the polarization of the beam to be a factor. When using a laser with linear polarization, this effect is only seen when cutting acrylic material thicker than 0.4" thick, and again, the top surface is a perfect circle, with elliptical underside.
Creating a circularly polarized beam
The majority of lasers emit linearly polarized light; therefore, they must somehow be converted to circular polarization. Depending on laser mounting and beam delivery, a circular polarizer module (also known as a cut quality enhancer) is commonly used to achieve circular polarization. When using a laser like the Firestar i401 where the polarization vector is rotated 45°, circular polarization is easily achieved by reflecting the beam 90° off of a reflective phase retarding mirror (available from most optical component suppliers).
The Role of Assist Gases in CO2 Laser Processing
Assist gases perform a number of functions in material processing applications, depending on the type of process being performed. Some of these functions include:
- Aid removal of cut or drilled debris
- Minimize heat-affected zones
- Shield/shroud processing area
- Protect optical components
While determining the appropriate assist gas type and its optimal delivery can be a complex task and varies with each type of laser application, this paper provides a few general guidelines for the proper use of assist gases.
The expense of assist gases means its usage and delivery should be optimized as much as possible. A few considerations include optimizing the nozzle exit orifice diameter, optimizing nozzle standoff, and tailoring gas pressure to the process requirements. While the first two points are self-explanatory, fine-tuning the assist gas pressure requires a bit more experimentation to achieve optimal conditions.
Plastics and organics
When processing plastic and organic materials, the gas jet must cool the sides of the cuts to reduce melt-back, charring, and surface discoloration.
For thermoplastics, the assist gas set-up is straightforward: low pressure (less than 5 PSI) nitrogen or breathing-grade air that is filtered to meet ISO 8573 Class 1 specifications. There is little difference between the two gases. Increased pressure tends to cause excessive burring on the underside of the cut. For thermosets and composites, gas pressure is usually increased (greater than 5 PSI) as charring and surface discoloration become more of a problem. In thicker materials, this problem is more apparent. The appropriate gas pressure must be determined by balancing the requirements of the exact material itself, and the overall cut quality.
To improve edge quality and reduce surface discoloration, the best solution is often to use greater than adequate power to cut the material and to increase gas pressure. This effectively widens the cut, allowing more gas to flow through, thereby minimizing charring and surface discoloration. Reducing this width by increasing speed causes a larger percentage of the gas to simply flow across the material surface, reducing the efficiency of the assist gas, and possibly aiding surface discoloration by drawing in and moving vapors along the material surface that would otherwise pass through the cut. If speed is critical, a lower gas pressure is advised.
A good case example of the differences produced by gas pressure occurs when cutting PET plastic. At low assist gas pressures (below 40-50 PSI through a 1 mm diameter nozzle), cutting produces charred, poor-quality edges similar to polycarbonate. However, when higher pressure is used (50-70 PSI), charring is eliminated and cut edges are clean. This effect occurs because the high flow rate rapidly cools the plastic before it can chemically degrade.
A number of thermosets eject vapor out and back along the cut length. In such cases, increasing assist gas pressure can worsen the effect. The gas pressure should be minimized, and some form of top-side fume extraction should be implemented. It is also worth noting that if the surface appearance is critical, the side from which the cut is made can be important. The best surface may be achieved facing the materials either towards or away from the laser beam, depending on the material. As thermoset and composite materials tend to cut by burning, the use of air can sometimes offer a slight speed advantage over nitrogen. This is particularly relevant when cutting wood.
Metals
When cutting and drilling ferrous metals, the primary function of assist gas is to aid cutting by means of an exothermic reaction with the iron and to force the molten material through the cut or hole. Most often, an oxygen assist gas is delivered through a coaxial nozzle at high pressure, typically 20-100 PSI. For example, consider cutting 1.5-mm-thick steel. Cutting fine details requires higher pressure, typically 60 PSI, than does less detailed cutting. Excess gas pressure actually cools the cut and the surrounding material adjacent to the cut, helping to reduce any over-burning effects. A less detailed pattern could use less than 30 PSI, as the gas jet is not required to assist part cooling.
When cutting stainless steel, another option for assist gas is high-pressure nitrogen, which unlike oxygen is inert and as a result there is minimal heat affected zone (HAZ) and elimination of oxidation on the cut edge. This produces a clean, shiny edge that can be welded, if necessary, with no need for post-cut cleaning. One disadvantage is that high-pressure nitrogen cut speeds are reduced 25-50% from those achieved when using oxygen, which slows the overall workflow. Cost is another disadvantage. Because nitrogen assist gas pressures are typically very high—running from 150 to 250 PSI (through a 1mm wide nozzle)—the additional consumption adds more cost even though nitrogen is less expensive than high-purity oxygen. Another important concern when using high-pressure assist gases is to verify your focusing optic can withstand the pressures involved. A thicker focusing lens, and even a heavy-duty gas jet manifold, may be necessary.
Requirements for welding metals are more dependent on the type of assist gas and the delivery strategy being used. Each material has well-documented shielding gas requirements based on arc welding, which can usually be applied to laser welding. The primary role of the assist gas is oxidation protection by shielding the molten pool with inert (argon or helium) or pseudo-inert gases (nitrogen). Occasionally, when laser welding, the assist gas or gas combinations need to be modified as well as the means by which the gas is delivered to the process area.
In order to achieve blanket coverage, welding commonly uses fairly diffuse side jets angled toward the weld area. Typical bore diameters of 0.125" and pressures less than 20 PSI are used. The jets should be directed slightly above the weld pool to avoid disrupting the solidification of the weld, or made diffuse enough to have no significant effect.
In the majority of applications, the processing operation will generate a certain amount of fumes, vapors, and particles that will potentially harm the optics of the laser system. The assist gas, therefore, also serves as a means of protecting the optics by blowing these substances away from the lens. An assist gas will benefit even applications that do not require its use for any of the other above-mentioned reasons.
Assist gas quality
As mention earlier, assist gas should be filtered to ISO 8573 Class 1 specifications, even when it is bottled by the gas vendor. In application where compressed air is used as the assist gas, it must be filtered to meet ISO 8573-1:2010 Class 1, 2, 1 specifications in order to remove all traces of water and oil vapor. Any accumulation of oil or water vapor on optical surfaces may lead to localized heating of the optics substrate leading to catastrophic failure.
Assist gas purity is also very important, as low purity gas will affect processing quality. Recommended gas purity percentages for typical assist gases are listed below:
- Air, breathing grade greater than or equal to 99.9996% purity; filtered to ISO 8573-1:2010 Class 1
- Air, compressed Instrument-grade air filtered to ISO 8573-1:2010 Class 1, 2, 1
- Argon, high-purity grade greater than or equal to 99.9980% purity; filtered to ISO 8573-1:2010 Class 1
- Helium, high-purity grade greater than or equal to 99.9970% purity; filtered to ISO 8573-1:2010 Class 1
- Nitrogen, high-purity grade greater than or equal to 99.9500% purity; filtered to ISO 8573-1:2010 Class 1
- Oxygen, ultra-pure grade greater than 99.9998%; filtered to ISO 8573-1:2010 Class 1
____
SYNRAD, Inc. • 4600 Campus Place • Mukilteo, WA 98275 USA
tel 1.425.349.3500 • fax 1.425.349.3667 • toll-free 1.800.SYNRAD1
• e-mail [email protected] • www.synrad.com


