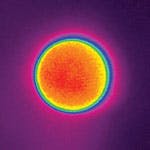
Beam profiling a high power fiber laser
Logan, UT - Laser beams are like light bulbs: they change in output over time. When laser manufacturing high precision, high reliability parts, this presents a challenge. Because of this, there is a need to regularly measure and manage the characteristics that determine a beam's quality and consistency.
There are several steps involved in maintaining a laser's efficiency over time. This maintenance is important to help prevent laser output variation from affecting the end product being manufactured.
One of the first steps to decrease these adverse effects is beam measurement. To ensure that the process remains consistent, key laser parameters - such as laser power or energy, beam size, and spatial distribution - must remain unchanged. As a laser ages, the changes in these data points can indicate degradation of the system's components. Data from the laser needs to be collected and analyzed, either by visual inspection or with laser measurement equipment, such as cameras, meters, and beam analysis software.
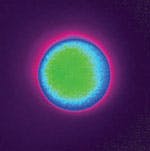
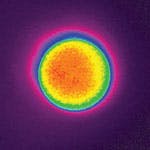
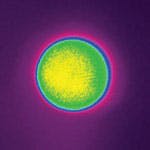
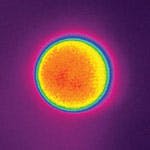
An Ophir customer wanted to monitor the performance of its laser over time. The customer had a 1 kW fiber laser that was being used to repair airplane engine components through a direct metal deposition process. This process allows a focused laser beam to adhere metal powder to a damaged metal piece. The customer was expecting the test would show a Gaussian profile for the laser beam, but it was discovered that the test was actually producing a flat top profile. Such a change can mean the difference between a precision cut provided by a Gaussian profile laser beam versus a beam that provides less penetration, but a faster means of adding metal powder.
A typical laser measurement setup includes a laser source, lenses to dissipate the beam, meters to measure the laser's power and energy, and an imaging device interfaced with beam profiling software to see the actual form of the beam, also known as the beam profile. In this case, the laser being tested was a 1070 nm fiber laser source with 600 μm fiber, CW, 1 kW maximum average power by a Spiricon SP620U silicon CCD camera and BeamGage® Professional laser profiling software. The laser's performance was measured at 350 W, 500 W and 750 W, as shown in FIGURES 1 to 3. During the test of this relatively new and stable laser, it was observed that differences in power levels resulted in only slightly different energy distribution across the focused spot. However, different power levels resulted in different spot sizes.
When working with a process like direct metal deposition, or any other laser sintering processes, preparation and setup time is of the essence as the costly parts being built take a relatively long time to finish. In this case, the manufacturer put a regular, periodic beam measurement program in place to assure them the laser's performance remains consistent over time. Depending on the demands of the process, the program can be run quarterly, monthly, weekly, or on a shift-by-shift basis. With this program, the manufacturer now knows that many of the variables that lasers can introduce to the process are being monitored and addressed, as needed.
For more information, contact John McCauley, midwest regional sales manager, Ophir Photonics Group, at [email protected].
More Industrial Laser Solutions Current Issue Articles
More Industrial Laser Solutions Archives Issue Articles

